
 30.03.2023 01:04 PM
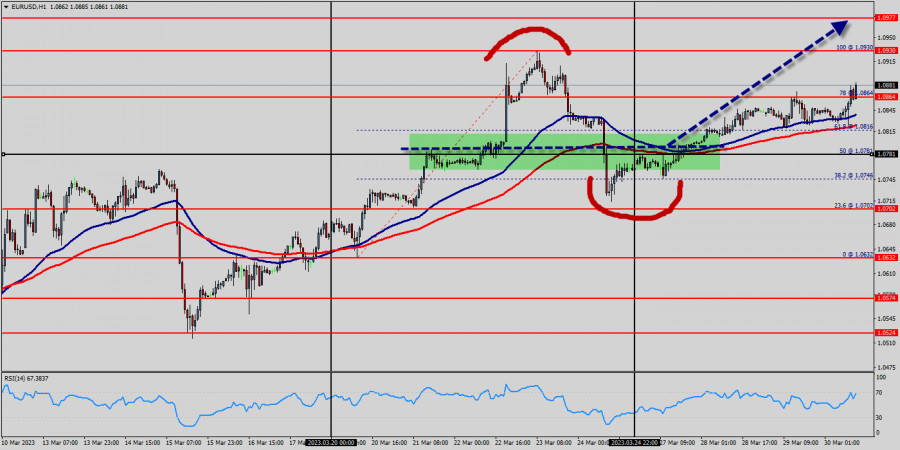
After finding bids reach to 1.0864, the EUR/USD pair price recovered above 1.0781 and 1.0803. Initial the EUR/USD pair resistance lies near the 1.0864 level (78% of Fibonacci retracement levels). A decent breakout and follow-up move above 1.0781 or/and 1.0803 could open the gate for a push towards the 1.0930 level. The main support remains near the area of 1.0781 and 1.0702. Also it should be noted that the EUR/USD pair and packets of pairs unite as the bulls gain their momentum.
The market is indicating a bullish opportunity above the above-mentioned support levels, for that the bullish outlook remains the same as long as the 100 EMA is headed to the upside. The EUR/USD pair increased within an up channel. Closing above the pivot point (1.0781) could assure that the EUR/USD pair will move higher towards cooling new highs. The bulls must break through 1.0903 in order to resume the up trend.
Trading recommendations :
The trend is still bullish as long as the price of 1.0781 is not broken. Thereupon, it would be wise to buy above the price of at 1.0781 with the primary target at 1.0903. Then, the EUR/USD pair will continue towards the second target at 1.0977 (a new target is around 1.1000in coming days).
Alternative scenario:
The breakdown of 1.0781 will allow the pair to go further down to the prices of 1.0703 and 1.0632.
Uptrend scenario :
An uptrend will start as soon, as the market rises above support level 1.0781, which will be followed by moving up to resistance level 1.0903. Further close above the high end may cause a rally towards 1.0977 and 1.1000. Nonetheless, the weekly resistance level and zone should be considered.
Downtrend scenario :
On the downside, the 1.0781 level represents support. The next major support is located near the 1.0703, which the price may drift below towards the 1.0632 support region.
You have already liked this post today
*The market analysis posted here is meant to increase your awareness, but not to give instructions to make a trade.
في بداية الجلسة الأمريكية، يتداول زوج اليورو/الدولار الأمريكي حول مستوى 1.1266، حيث يصل إلى قمة قناة الاتجاه الهابط ويظهر علامات على الإرهاق. خلال افتتاح التداول هذا الأسبوع، ترك اليورو فجوة
روابط مفيدة: مقالاتي الأخرى متوفرة في هذا القسم دورة InstaForex للمبتدئين التحليلات الشائعة افتح حساب تداول مهم: يجب على المبتدئين في تداول الفوركس أن يكونوا حذرين للغاية عند اتخاذ قرارات
على الرسم البياني الساعي، استمر زوج الجنيه الإسترليني/الدولار الأمريكي في التحرك بشكل جانبي يوم الجمعة، متذبذبًا بين المستويات 1.3205 و1.3344. بعد الرفض من منطقة المقاومة بين 1.3344 و1.3357، لا يزال
على الرغم من أن البائعين لا يزالون يسيطرون على زوج اليورو/الين الياباني في الرسم البياني لمدة 4 ساعات، وهذا ما تؤكده حركة السعر التي تتحرك تحت المتوسط المتحرك المرجح (21)
شارت الفوركس
على شبكة الانترنت

Your IP address shows that you are currently located in the USA. If you are a resident of the United States, you are prohibited from using the services of InstaFintech Group including online trading, online transfers, deposit/withdrawal of funds, etc.
If you think you are seeing this message by mistake and your location is not the US, kindly proceed to the website. Otherwise, you must leave the website in order to comply with government restrictions.
Why does your IP address show your location as the USA?
Please confirm whether you are a US resident or not by clicking the relevant button below. If you choose the wrong option, being a US resident, you will not be able to open an account with InstaTrade anyway.
We are sorry for any inconvenience caused by this message.

