النماذج الفعلية

النماذج هي نماذج رسومية تتشكل في الرسم البياني حسب السعر. وفقا لأحد المسلمات التحليلية الفنية، فإن التاريخ (حركة السعر) يكرر نفسه. ويعني ذلك أن حركات الأسعار غالباً ما تكون متشابهة في نفس الأوضاع مما يجعل من الممكن التنبؤ بزيادة تطوير الوضع الذي يتسم باحتمال كبير.
النماذج ذات الصلة المقدمة من قبل إنستافوركس هي خدمة سهلة الاستخدام تسمح لك بمعرفة التغييرات الأخيرة في السوق والرد على الأدلة من السوق في الوقت المناسب. في خدمتنا، ستجد دائمًا النماذج الأكثر حداثة وملاءمة في أي زوج وأي إطار زمني.
Bullish Rectangle
was formed on 24.04 at 09:19:04 (UTC+0)
signal strength 3 of 5
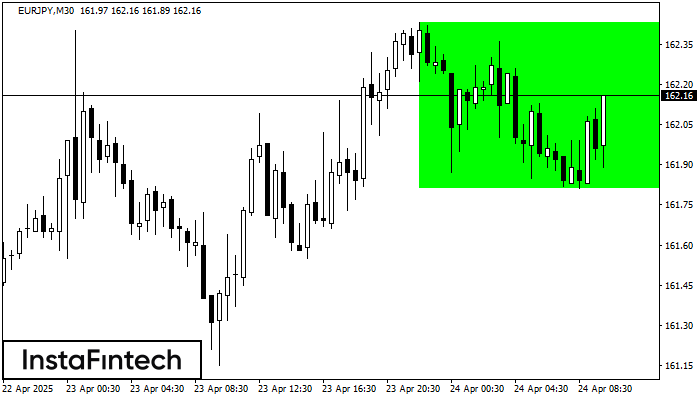
According to the chart of M30, EURJPY formed the Bullish Rectangle. The pattern indicates a trend continuation. The upper border is 162.43, the lower border is 161.81. The signal means that a long position should be opened above the upper border 162.43 of the Bullish Rectangle.
انظر أيضا
- All
- All
- Bearish Rectangle
- Bearish Symmetrical Triangle
- Bearish Symmetrical Triangle
- Bullish Rectangle
- Double Top
- Double Top
- Triple Bottom
- Triple Bottom
- Triple Top
- Triple Top
- All
- All
- Buy
- Sale
- All
- 1
- 2
- 3
- 4
- 5
Triple Bottom
was formed on 11.06 at 23:05:39 (UTC+0)
signal strength 1 of 5
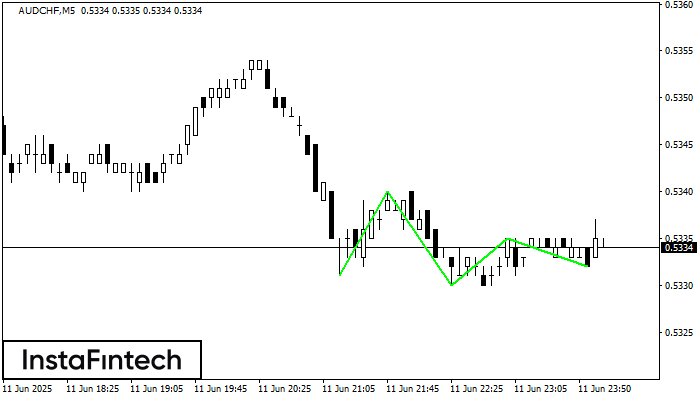
The Triple Bottom pattern has been formed on AUDCHF M5. It has the following characteristics: resistance level 0.5340/0.5335; support level 0.5331/0.5332; the width is 9 points. In the event
The M5 and M15 time frames may have more false entry points.
Open chart in a new window
Double Bottom
was formed on 11.06 at 23:00:24 (UTC+0)
signal strength 5 of 5
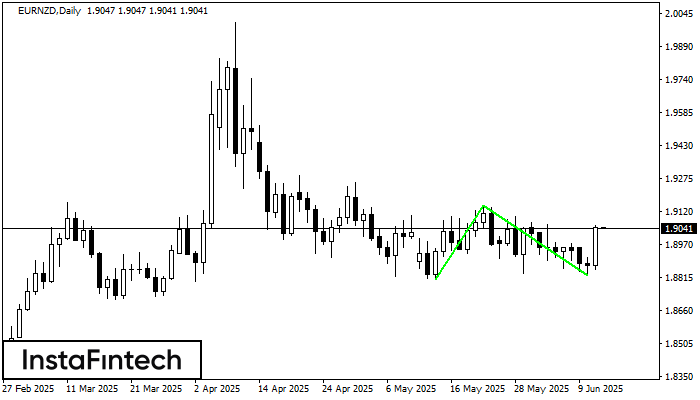
The Double Bottom pattern has been formed on EURNZD D1. Characteristics: the support level 1.8805; the resistance level 1.9150; the width of the pattern 345 points. If the resistance level
Open chart in a new window
Double Bottom
was formed on 11.06 at 23:00:13 (UTC+0)
signal strength 2 of 5
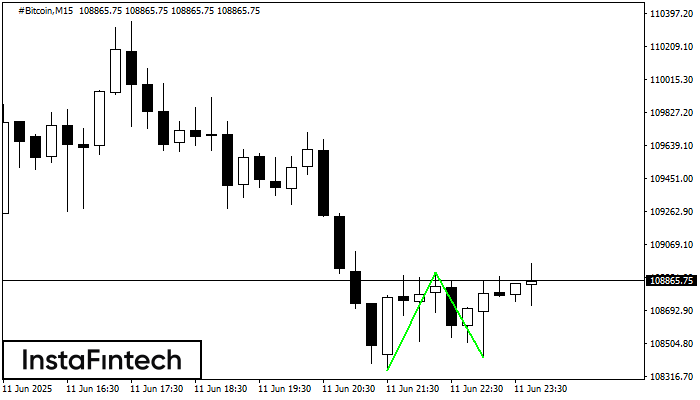
The Double Bottom pattern has been formed on #Bitcoin M15. Characteristics: the support level 108349.64; the resistance level 108909.75; the width of the pattern 56011 points. If the resistance level
The M5 and M15 time frames may have more false entry points.
Open chart in a new window