আরও দেখুন

 27.09.2024 10:47 AM
EUR/USD
Larger timeframes
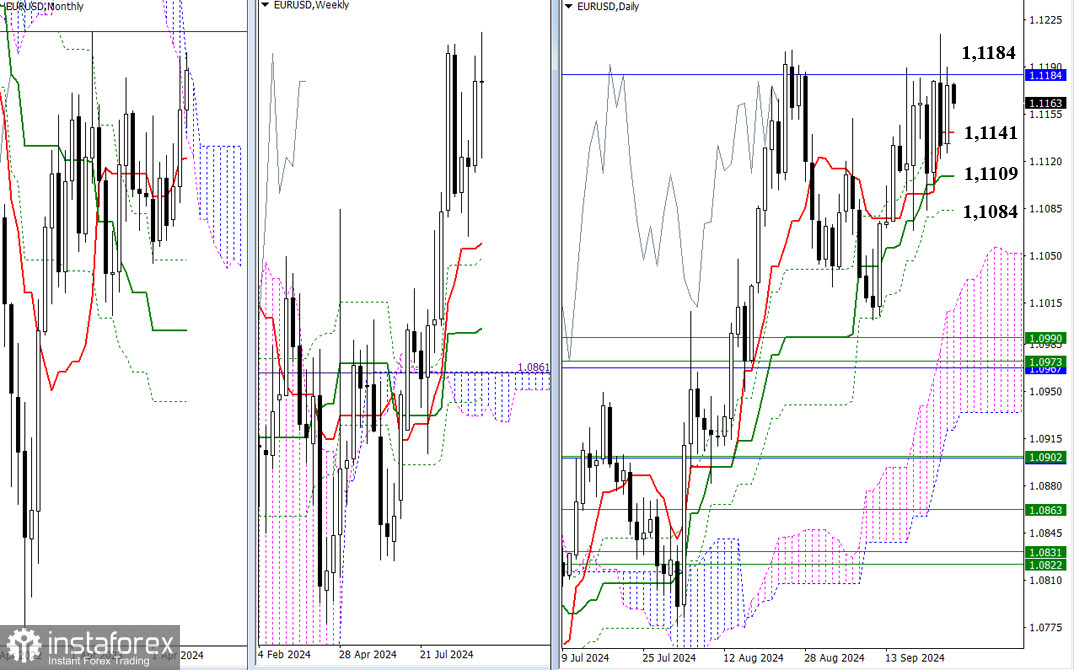
This week, the EUR/USD pair has been consolidating below the upper border of the one-month cloud (1.1184). Bearish traders have managed a few times to destroy all of their opponents' gains, bringing the price back to the short-term daily trend channel. As a result, the consolidation range and the current uncertainty can now be defined by the one-month resistance at 1.1184 and the support levels of the daily Ichimoku cross (1.1141 – 1.1133 – 1.1109 – 1.1084). If the instrument breaks out beyond these levels and firmly settles outside these borders, this will open up new prospects for EUR/USD.
H4 – H1 timeframes
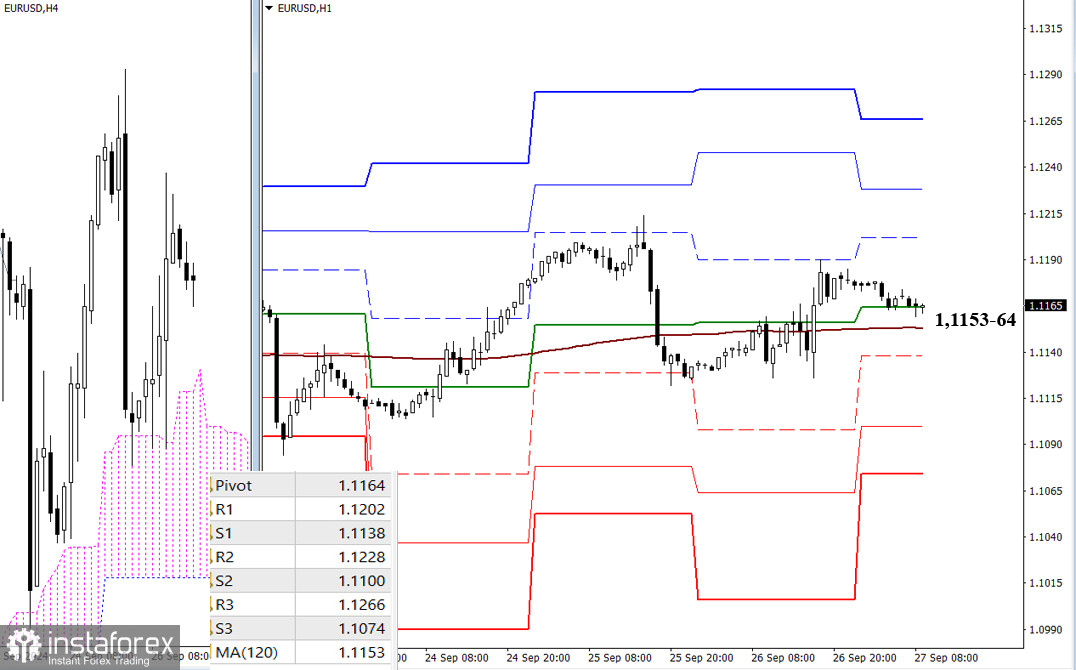
On the lower timeframes, key levels of 1.1153 – 1.1164 (the central pivot level of the day + the weekly long-term trend) remain horizontal, maintaining uncertainty. The instrument is fluctuating above and below these levels, winding around the trend line. If a directional movement develops, attention will shift to other reference points on the lower timeframes. In the case of an upward move, the resistances of the classic Pivot levels (1.1202 – 1.1228 – 1.1266) will be of interest to bulls. If the EUR/USD pair declines, the classic Pivot level supports (1.1138 – 1.1100 – 1.1074) may come into play.
***
GBP/USD
Larger timeframes
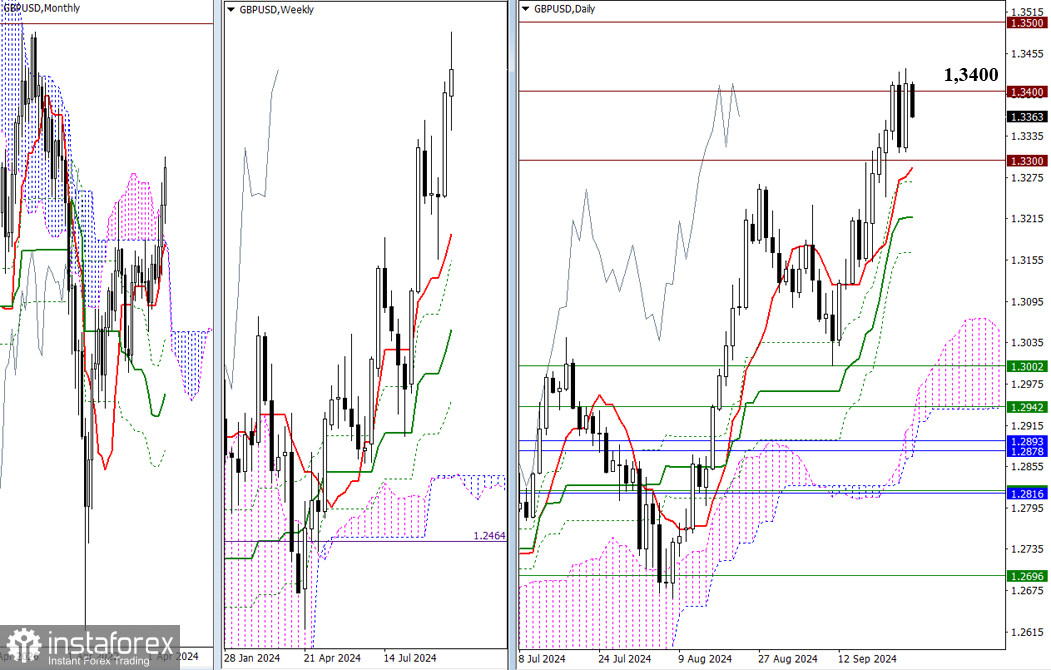
As the week is coming to an end, the market is still struggling to decide on the 1.3400 level. A breakout of this level will pave the way for new bullish prospects, potentially driving the price toward the next psychological resistance at 1.3500. A rejection will bring the price back to the previous level of 1.3300, followed by testing the supports of the daily Ichimoku cross (1.3289 – 1.3217 – 1.3166). Let's wait for the week's close to see which trading force secures the advantage, though uncertainty may prevail at this stage.
H4 – H1 timeframes
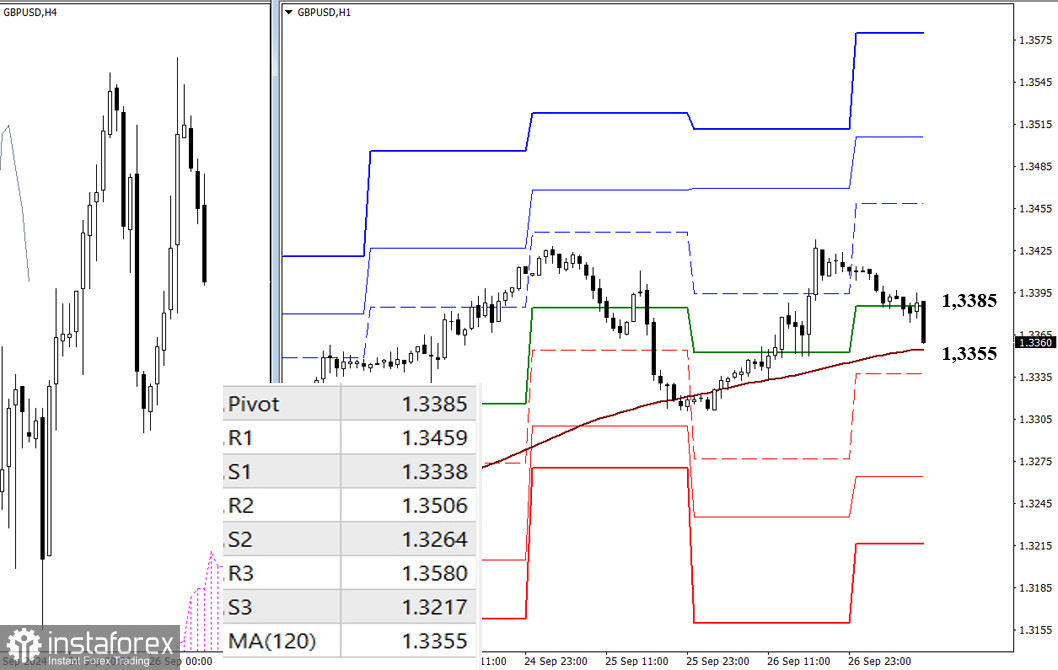
On the lower timeframes, the market is descending toward key support levels, located today at 1.3385 – 1.3355 (central Pivot level + weekly long-term trend). Control of the trend provides the primary advantage. Additional intraday reference points are the classic Pivot levels, meaning an upward move would pass through resistances (1.3459 – 1.3506 – 1.3580), while a downward move would go through supports (1.3338 – 1.3264 – 1.3217).
***
This technical analysis is based on the following ideas:
Larger timeframes - Ichimoku Kinko Hyo (9.26.52) + Fibo Kijun levels
H1 – classic pivot points + 120-period Moving Avarage (weekly long-term trendline)
You have already liked this post today
*এখানে পোস্ট করা মার্কেট বিশ্লেষণ আপনার সচেতনতা বৃদ্ধির জন্য প্রদান করা হয়, ট্রেড করার নির্দেশনা প্রদানের জন্য প্রদান করা হয় না।


