আরও দেখুন


 17.01.2025 09:14 AM
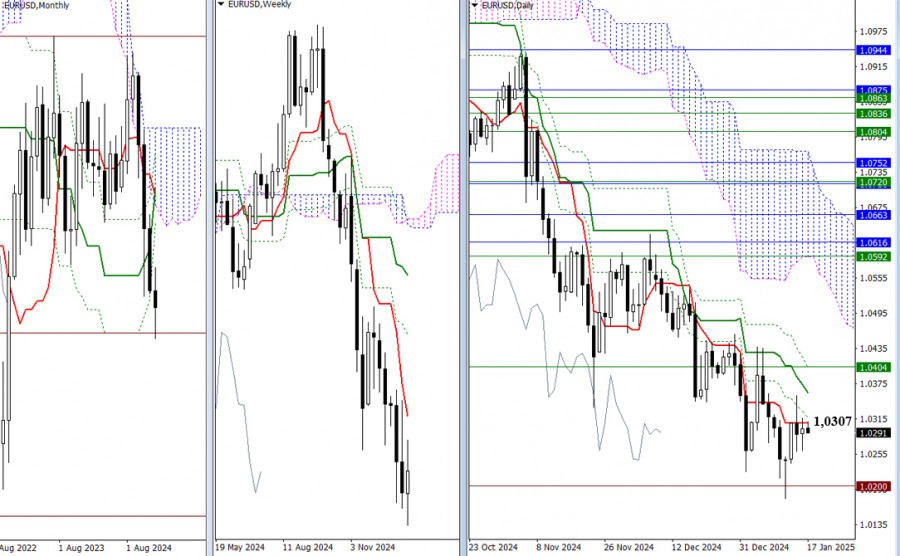
The past day has been marked by uncertainty and stagnation in the market. The currency pair is currently drawn to the daily short-term trend zone at 1.0308. As we approach the end of the week, it is crucial for bullish traders to ensure that the weekly candle only has a small upper wick. For the bulls to gain momentum, they need to break through the Ichimoku daily dead cross (which ranges from 1.0307 to 1.0402) and reclaim the weekly short-term trend at 1.0404. On the other hand, bearish traders are focused on breaking through the historical support level at 1.0200, which could reestablish the downtrend at 1.0179.
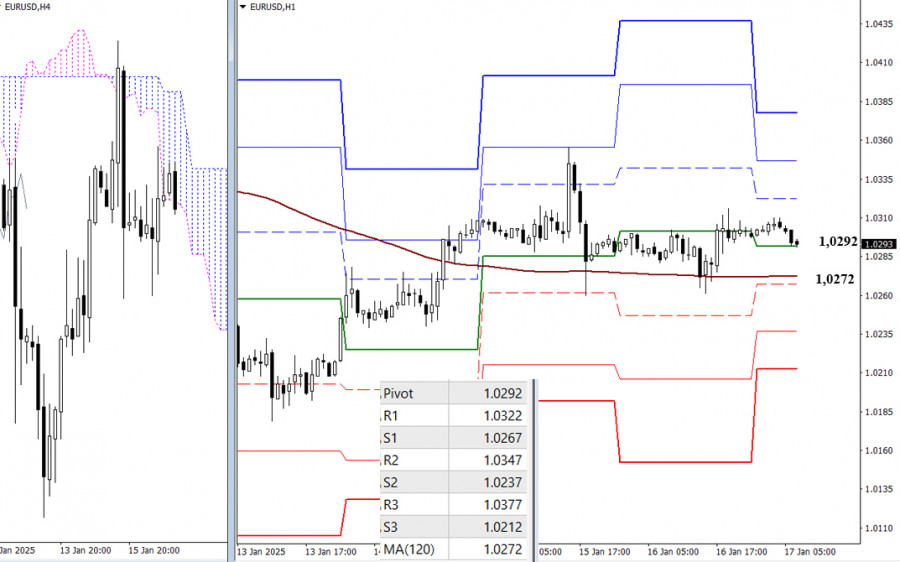
On lower timeframes, key support levels are currently being tested. Today, these levels are identified at 1.0292 (the Central Pivot Point for the day) and 1.0272 (the weekly long-term trend). As long as the price remains above these levels, it will favor the bulls and maintain their advantage. However, if the price breaks below these levels and reverses the trend, it could give the bears the upper hand and open the door to further bearish momentum. In terms of intraday movements, additional targets include resistances at 1.0322, 1.0347, and 1.0377, as well as supports at 1.0267, 1.0237, and 1.0212, based on classic Pivot Points.
***
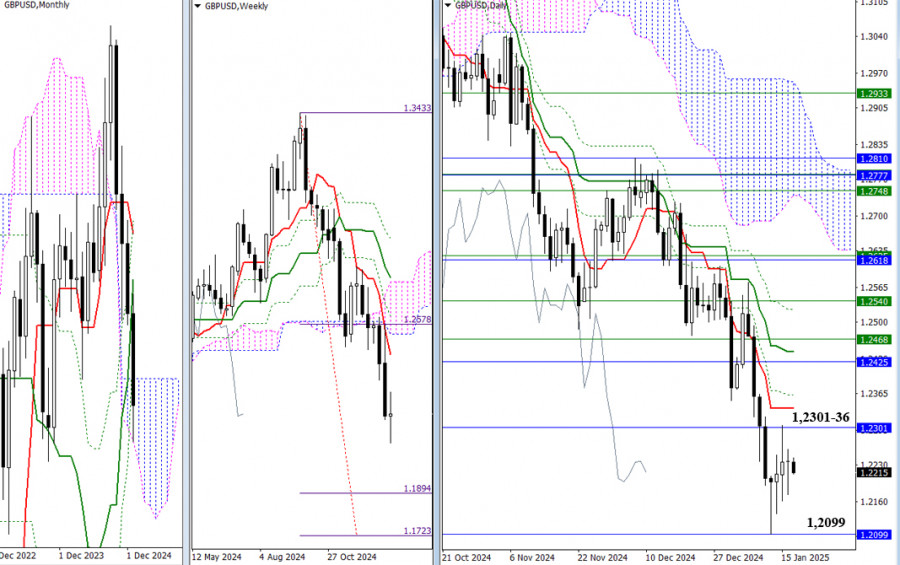
The British pound continues to show daily uncertainty. If this trend persists today, the weekly candle will also reflect indecision. The nearest targets remain unchanged under these circumstances. For bulls, the goal is to break above the monthly Ichimoku cloud at 1.2301 to enter bullish territory and to establish control over the daily short-term trend at 1.2336. For bears, the priority is to break below the lower boundary of the monthly cloud at 1.2099, securing a bearish stance relative to the cloud.
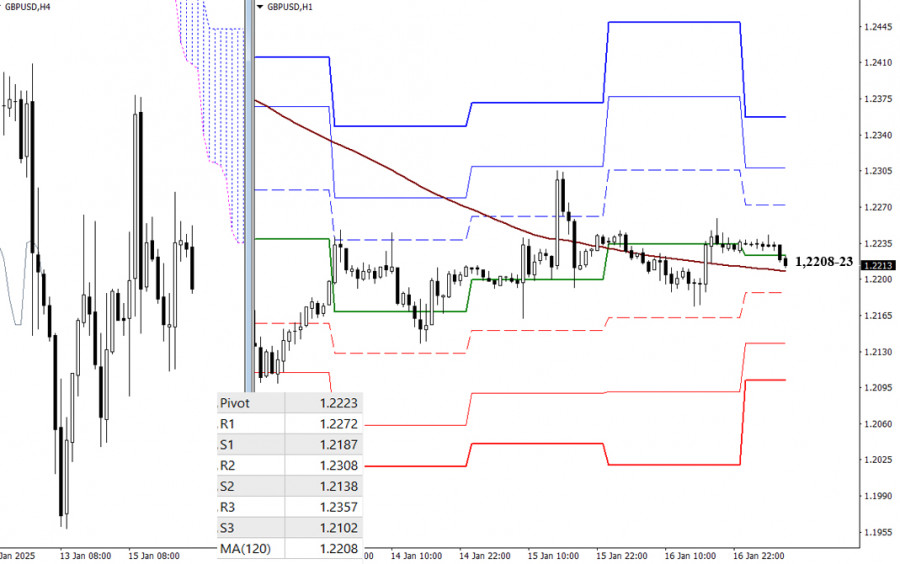
On the H4 and H1 timeframes, the pair is consolidating around the weekly long-term trend level at 1.2208 due to the uncertainty on higher timeframes. Gaining control of this trend and reversing it will provide a further directional advantage. If bulls succeed, the intraday resistance targets are 1.2272, 1.2308, and 1.2357, based on classic Pivot Points. Conversely, if bears initiate a directional movement first, their intraday support targets will be 1.2187, 1.2138, and 1.2102.
***
You have already liked this post today
*এখানে পোস্ট করা মার্কেট বিশ্লেষণ আপনার সচেতনতা বৃদ্ধির জন্য প্রদান করা হয়, ট্রেড করার নির্দেশনা প্রদানের জন্য প্রদান করা হয় না।
মার্কিন সেশনের শুরুতে গোল্ড $3,220 এর আশেপাশে ট্রেড করছে এবং দুর্বলতার লক্ষণ দেখা যাচ্ছে। আগামী কয়েক ঘণ্টায় 21 SMA-র দিকে আরও একটি টেকনিক্যাল কারেকশন হওয়ার সম্ভাবনা রয়েছে। H4 চার্টে দেখা
মার্কিন সেশনের শুরুতে, স্বর্ণ $3,021 এর আশেপাশে ট্রেড করছে, যে লেভেলটি 21-SMA এর নিচে এবং ১৯ মার্চ থেকে গঠিত হওয়া বিয়ারিশ ট্রেন্ড চ্যানেলের মধ্যে অবস্থিত। H4 চার্টে আমরা দেখতে পাচ্ছি
মার্কিন সেশনের শুরুতে, গোল্ড $3,039 লেভেলের কাছাকাছি ট্রেড করছে, মূল্য +2/8 মারে লেভেলের নিচে অবস্থান করছে এবং ওভারবট লেভেলে পৌঁছেছে। প্রযুক্তিগতভাবে, স্বর্ণের তীব্র দরপতনের সম্ভাবনা রয়েছে। ইউরোপীয় সেশনে, স্বর্ণের মূল্য
মার্কিন সেশনের শুরুতে, স্বর্ণ $2,904-এ ট্রেড করা হচ্ছি, যা ইউরোপিয়ান সেশনে 6/8 মারে ($2,889) টেস্ট করার পর পুনরুদ্ধার করেছে। আগামী কয়েক ঘণ্টার মধ্যে স্বর্ণের মূল্যের ঊর্ধ্বমুখী প্রবণতা বজায় থাকতে পারে
টেকনিক্যালি, স্বর্ণের মূল্য ওভারবট লেভেলে পৌঁছেছে। তবে, আমরা ধারণা করছি যে টেকনিক্যাল কারেকশন আরও কিছু সময়ের জন্য চলতে পারে, যেখানে মূল্য $2,890 (6/8 মারে) এবং 21 SMA লেভেলের কাছাকাছি $2,880-এ
মার্কিন সেশনের শুরুতে, গোল্ড $2,758 এর আশেপাশে ট্রেড করছে, যা 7/8 মারে-এর নিচে এবং জানুয়ারির শুরু থেকে গঠিত আপট্রেন্ড চ্যানেলের মধ্যে রয়েছে। গোল্ডের দরপতনের লক্ষণ দেখা যাচ্ছে। তাই, পরবর্তী কয়েক
Forex Chart
Web-version

Your IP address shows that you are currently located in the USA. If you are a resident of the United States, you are prohibited from using the services of InstaFintech Group including online trading, online transfers, deposit/withdrawal of funds, etc.
If you think you are seeing this message by mistake and your location is not the US, kindly proceed to the website. Otherwise, you must leave the website in order to comply with government restrictions.
Why does your IP address show your location as the USA?
Please confirm whether you are a US resident or not by clicking the relevant button below. If you choose the wrong option, being a US resident, you will not be able to open an account with InstaTrade anyway.
We are sorry for any inconvenience caused by this message.


