অ্যাকচুয়াল প্যাটার্নস

প্যাটার্ন হলো গ্রাফিক্যাল মডেল, যা মূল্য ওঠানামার ভিত্তিতে চার্টে তৈরি হয়। টেকনিক্যাল বিশ্লেষণের নীতি অনুযায়ী, ইতিহাসের (প্রাইস মুভমেন্ট) পুনরাবৃত্তি ঘটে। অর্থাৎ, পরিস্থিতি যদি একই রকম থাকে তাহলে প্রাইস মুভমেন্টও প্রায় একই রকম হয়। এর ফলে মূল্যের ওঠানামা কেমন হবে তা আগেই থেকেই অনুমান করা যায়।
ইন্সটাফরেক্স এর প্রাসঙ্গিক প্যাটার্নসমূহ সহজেই ব্যবহার করা যায়, যার মাধ্যমে মার্কেটের সর্বশেষ পরিস্থিতি জানা যায় এবং তার উপর ভিত্তি করে সিদ্ধান্ত নেওয়া যায়। আমাদের সেবাগুলো থেকে আপনি যেকোনো পেয়ার এবং টাইমফ্রেমের জন্য সর্বশেষ এবং সবচেয়ে প্রাসঙ্গিক প্যাটার্নগুলো খুঁজে পাবেন।
Bearish Symmetrical Triangle
was formed on 01.04 at 09:09:30 (UTC+0)
signal strength 3 of 5
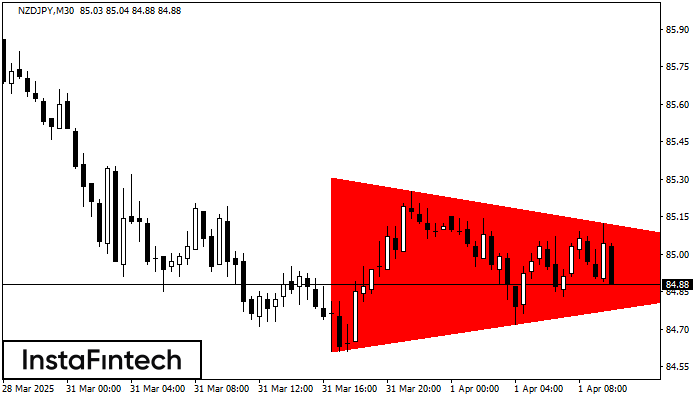
According to the chart of M30, NZDJPY formed the Bearish Symmetrical Triangle pattern. This pattern signals a further downward trend in case the lower border 84.61 is breached. Here, a hypothetical profit will equal the width of the available pattern that is -69 pips.
- All
- All
- Bearish Rectangle
- Bearish Symmetrical Triangle
- Bearish Symmetrical Triangle
- Bullish Rectangle
- Double Top
- Double Top
- Triple Bottom
- Triple Bottom
- Triple Top
- Triple Top
- All
- All
- Buy
- Sale
- All
- 1
- 2
- 3
- 4
- 5
Double Bottom
was formed on 01.05 at 20:11:19 (UTC+0)
signal strength 1 of 5
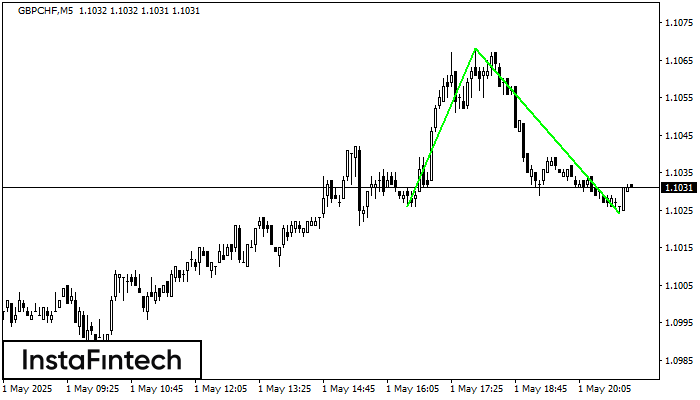
The Double Bottom pattern has been formed on GBPCHF M5. This formation signals a reversal of the trend from downwards to upwards. The signal is that a buy trade should
The M5 and M15 time frames may have more false entry points.
Open chart in a new window
Bullish Rectangle
was formed on 01.05 at 18:33:45 (UTC+0)
signal strength 1 of 5
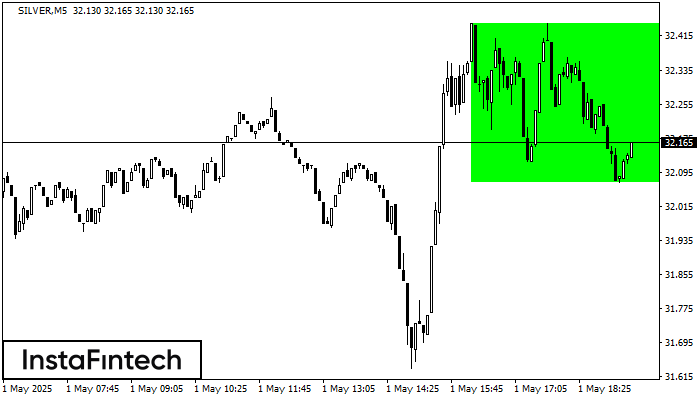
According to the chart of M5, SILVER formed the Bullish Rectangle. The pattern indicates a trend continuation. The upper border is 32.45, the lower border is 32.07. The signal means
The M5 and M15 time frames may have more false entry points.
Open chart in a new window
Double Top
was formed on 01.05 at 18:30:14 (UTC+0)
signal strength 1 of 5
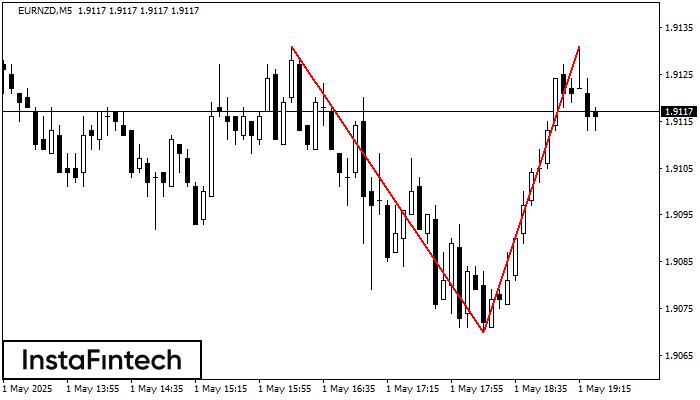
The Double Top reversal pattern has been formed on EURNZD M5. Characteristics: the upper boundary 1.9131; the lower boundary 1.9070; the width of the pattern is 61 points. Sell trades
The M5 and M15 time frames may have more false entry points.
Open chart in a new window