অ্যাকচুয়াল প্যাটার্নস

প্যাটার্ন হলো গ্রাফিক্যাল মডেল, যা মূল্য ওঠানামার ভিত্তিতে চার্টে তৈরি হয়। টেকনিক্যাল বিশ্লেষণের নীতি অনুযায়ী, ইতিহাসের (প্রাইস মুভমেন্ট) পুনরাবৃত্তি ঘটে। অর্থাৎ, পরিস্থিতি যদি একই রকম থাকে তাহলে প্রাইস মুভমেন্টও প্রায় একই রকম হয়। এর ফলে মূল্যের ওঠানামা কেমন হবে তা আগেই থেকেই অনুমান করা যায়।
ইন্সটাফরেক্স এর প্রাসঙ্গিক প্যাটার্নসমূহ সহজেই ব্যবহার করা যায়, যার মাধ্যমে মার্কেটের সর্বশেষ পরিস্থিতি জানা যায় এবং তার উপর ভিত্তি করে সিদ্ধান্ত নেওয়া যায়। আমাদের সেবাগুলো থেকে আপনি যেকোনো পেয়ার এবং টাইমফ্রেমের জন্য সর্বশেষ এবং সবচেয়ে প্রাসঙ্গিক প্যাটার্নগুলো খুঁজে পাবেন।
Bullish Symmetrical Triangle
was formed on 01.04 at 10:36:33 (UTC+0)
signal strength 3 of 5

According to the chart of M30, EURUSD formed the Bullish Symmetrical Triangle pattern. Description: This is the pattern of a trend continuation. 1.0849 and 1.0777 are the coordinates of the upper and lower borders respectively. The pattern width is measured on the chart at 72 pips. Outlook: If the upper border 1.0849 is broken, the price is likely to continue its move by 1.0844.
আরও দেখুন
- All
- All
- Bearish Rectangle
- Bearish Symmetrical Triangle
- Bearish Symmetrical Triangle
- Bullish Rectangle
- Double Top
- Double Top
- Triple Bottom
- Triple Bottom
- Triple Top
- Triple Top
- All
- All
- Buy
- Sale
- All
- 1
- 2
- 3
- 4
- 5
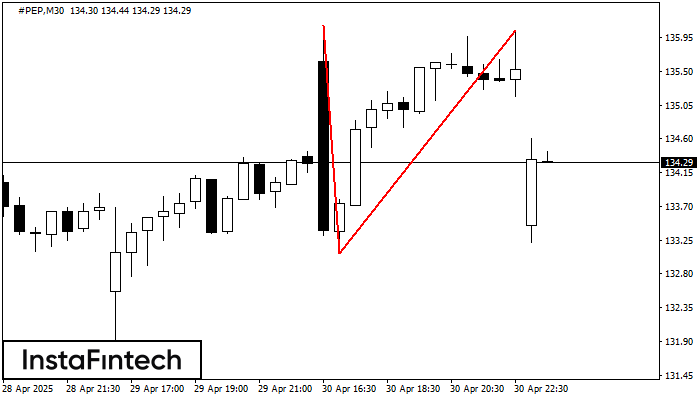
ডাবল টপ
was formed on 01.05 at 16:00:02 (UTC+0)
signal strength 3 of 5

M30 চার্টে, #PEP-এর ডাবল টপ প্যাটার্নটি গঠিত হয়েছে। এটি এই ইঙ্গিত দেয় যে চলমান প্রবণতা ঊর্ধ্বমুখী থেকে নিম্নমুখীতে পরিবর্তিত হয়েছে। সম্ভবত, যদি 133.07 প্যাটার্নের ভিত্তিটি ব্রেক করা হয়, তাহলে নিম্নমুখী
Open chart in a new window
ডাবল বটম
was formed on 01.05 at 16:00:01 (UTC+0)
signal strength 2 of 5
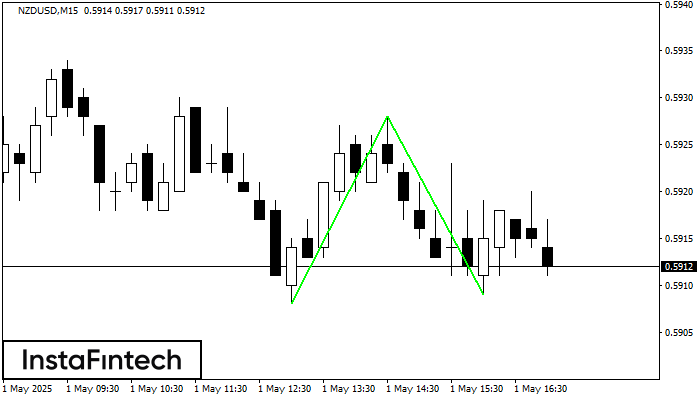
M15 চার্টে, NZDUSD-এর ডাবল বটম প্যাটার্নটি গঠিত হয়েছে। উপরের সীমানা হল 0.5928; নীচের সীমানা হল 0.5909। প্যাটার্নের প্রস্থ হল 20 পয়েন্ট। 0.5928-এর উপরের সীমানা ভেদ করার ক্ষেত্রে, প্রবণতা পরিবর্তনের পূর্বাভাস
M5 এবং M15 টাইম ফ্রেমে আরও ভুল এন্ট্রি পয়েন্ট থাকতে পারে।
Open chart in a new window
ডাবল টপ
was formed on 01.05 at 15:59:51 (UTC+0)
signal strength 3 of 5
M30 চার্টে, #PEP-এর ডাবল টপ প্যাটার্নটি গঠিত হয়েছে। এটি এই ইঙ্গিত দেয় যে চলমান প্রবণতা ঊর্ধ্বমুখী থেকে নিম্নমুখীতে পরিবর্তিত হয়েছে। সম্ভবত, যদি 133.07 প্যাটার্নের ভিত্তিটি ব্রেক করা হয়, তাহলে নিম্নমুখী
Open chart in a new window