অ্যাকচুয়াল প্যাটার্নস

প্যাটার্ন হলো গ্রাফিক্যাল মডেল, যা মূল্য ওঠানামার ভিত্তিতে চার্টে তৈরি হয়। টেকনিক্যাল বিশ্লেষণের নীতি অনুযায়ী, ইতিহাসের (প্রাইস মুভমেন্ট) পুনরাবৃত্তি ঘটে। অর্থাৎ, পরিস্থিতি যদি একই রকম থাকে তাহলে প্রাইস মুভমেন্টও প্রায় একই রকম হয়। এর ফলে মূল্যের ওঠানামা কেমন হবে তা আগেই থেকেই অনুমান করা যায়।
ইন্সটাফরেক্স এর প্রাসঙ্গিক প্যাটার্নসমূহ সহজেই ব্যবহার করা যায়, যার মাধ্যমে মার্কেটের সর্বশেষ পরিস্থিতি জানা যায় এবং তার উপর ভিত্তি করে সিদ্ধান্ত নেওয়া যায়। আমাদের সেবাগুলো থেকে আপনি যেকোনো পেয়ার এবং টাইমফ্রেমের জন্য সর্বশেষ এবং সবচেয়ে প্রাসঙ্গিক প্যাটার্নগুলো খুঁজে পাবেন।
Bearish Flag
was formed on 01.04 at 12:50:23 (UTC+0)
signal strength 1 of 5

The Bearish Flag pattern has been formed on the chart USDCHF M5. Therefore, the downwards trend is likely to continue in the nearest term. As soon as the price breaks below the low at 0.8817, traders should enter the market.
The M5 and M15 time frames may have more false entry points.
আরও দেখুন
- All
- All
- Bearish Rectangle
- Bearish Symmetrical Triangle
- Bearish Symmetrical Triangle
- Bullish Rectangle
- Double Top
- Double Top
- Triple Bottom
- Triple Bottom
- Triple Top
- Triple Top
- All
- All
- Buy
- Sale
- All
- 1
- 2
- 3
- 4
- 5
Triple Top
сформирован 18.04 в 15:15:28 (UTC+0)
сила сигнала 2 из 5
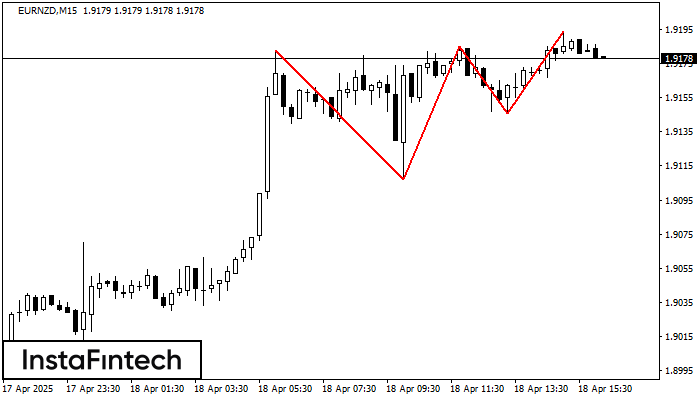
On the chart of the EURNZD M15 trading instrument, the Triple Top pattern that signals a trend change has formed. It is possible that after formation of the third peak
The M5 and M15 time frames may have more false entry points.
Открыть график инструмента в новом окне
Bearish Rectangle
сформирован 18.04 в 13:00:27 (UTC+0)
сила сигнала 3 из 5

According to the chart of M30, EURGBP formed the Bearish Rectangle. This type of a pattern indicates a trend continuation. It consists of two levels: resistance 0.8574 - 0.0000
Открыть график инструмента в новом окне
Triple Bottom
сформирован 18.04 в 11:50:33 (UTC+0)
сила сигнала 1 из 5

The Triple Bottom pattern has formed on the chart of the NZDCAD M5 trading instrument. The pattern signals a change in the trend from downwards to upwards in the case
The M5 and M15 time frames may have more false entry points.
Открыть график инструмента в новом окне