
Introduction
Brief Explanation of the Money Flow Index (MFI)
The Money Flow Index (MFI) is a highly regarded tool used by traders and investors in the financial market. As a technical oscillator, it combines both price and volume data to generate a value ranging from 0 to 100. This value is used to identify potential overbought and oversold conditions in a financial market, which in turn can signal potential opportunities for buying or selling. It’s often referred to as the volume-weighted relative strength index (RSI) because it integrates volume, echoing the dynamics of the RSI but with the additional dimension of market volume.
Importance of the MFI in Technical Analysis and Investment Strategies
In technical analysis and investment strategies, the MFI is a crucial component. Its ability to integrate price and volume data provides an enriched view of market dynamics. The MFI aids in identifying potential price reversals, indicating when an asset may be overbought or oversold. This provides valuable insights to traders and investors, assisting them in making informed decisions regarding their positions.
Moreover, the MFI is a potent tool in identifying price-volume divergences – situations where the price trend of an asset and its MFI trend don't align. These divergences can often precede significant price movements and thus can be a powerful component in trading and investing strategies.
In a broader context, understanding and correctly utilizing the MFI can lead to more effective risk management, improved decision-making, and potentially enhanced profitability in the market. As such, it continues to be a vital instrument in the toolbox of many successful traders and investors.
Understanding the Basics of the MFI Indicator
Defining the MFI Indicator
The Money Flow Index (MFI) is a technical indicator used in financial trading to estimate the efficiency and intensity of cash inflows and outflows into and out of a specific asset during a given period of time. It is a momentum oscillator, which means it measures the speed and change of price movements in a financial instrument.
The MFI operates on a scale from 0 to 100, similarly to other oscillators such as the Relative Strength Index (RSI). However, while the RSI only incorporates price, the MFI also factors in volume, providing a more comprehensive view of buying and selling pressure.
In essence, the MFI indicator provides traders and investors with an idea of whether an asset is overbought (too much buying pressure, potentially overvalued) or oversold (too much selling pressure, potentially undervalued). As such, it is frequently used to anticipate potential market reversals and optimize trade entries and exits.
The components of the MFI Indicator: typical price and volume
The Money Flow Index (MFI) indicator relies on two main components to provide its insights: typical price and volume.
1. Typical Price: The typical price is a key component in calculating the MFI. It's computed by taking the average of the high, low, and closing prices for a specific trading period. In mathematical terms, it's expressed as (High + Low + Close)/3. This provides a representative single price for each period that reflects the overall level of the trading activity.
2. Volume: Volume is the second critical component of the MFI calculation. It signifies the total number of shares or contracts traded within a specific period. It's an indicator of the market's activity level and offers insights into the intensity of trading in a particular security. High volumes often suggest strong investor interest and validate a current trend, while low volumes may indicate investor uncertainty or disinterest.
By combining typical price and volume, the MFI provides a comprehensive view of money flowing in and out of a security, giving a more detailed insight into market conditions than price-based indicators alone. It's this combination of price and volume that allows the MFI to detect potential overbought and oversold conditions, offering valuable signals for traders and investors.
The formula used in calculating the MFI Indicator
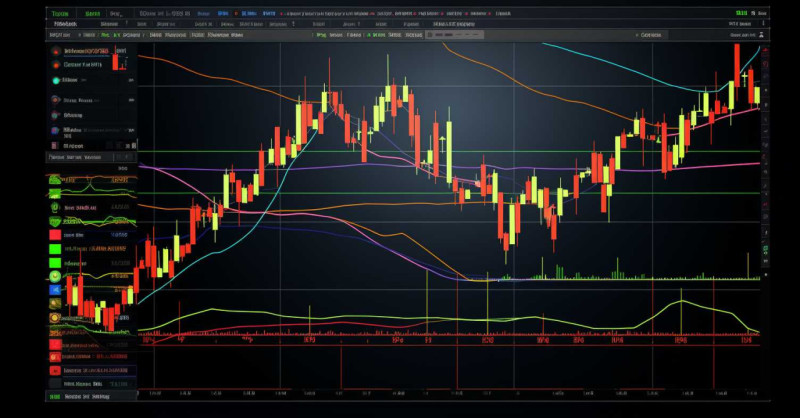
Calculating the Money Flow Index (MFI) involves several steps, using both price and volume data. Here is the breakdown of the formula:
1. Typical Price Calculation: The first step in the process is to calculate the typical price for each period. The typical price is the average of the high, low, and closing prices for the period. The formula is:
Typical Price = (High + Low + Close) / 3
2. Raw Money Flow Calculation: The next step is to calculate the raw money flow, which is the typical price multiplied by the volume for the period. The formula is:
Raw Money Flow = Typical Price * Volume
3. Positive and Negative Money Flow: If today's typical price is higher than yesterday's, the period is considered to have positive money flow, and the raw money flow is added to the positive money flow total. If today's typical price is lower, the period has negative money flow, and the raw money flow is added to the negative money flow total.
4. Money Flow Ratio: The Money Flow Ratio is calculated over a specified period (usually 14 periods). The formula is:
Money Flow Ratio = (14-period Positive Money Flow) / (14-period Negative Money Flow)
5. Money Flow Index Calculation: Finally, the Money Flow Index is calculated using the Money Flow Ratio. The formula is:
MFI = 100 - (100 / (1 + Money Flow Ratio))
This results in a value between 0 and 100. An MFI over 80 typically indicates that the asset is overbought (indicating a potential downturn), while an MFI under 20 indicates that the asset is oversold (suggesting a potential upturn).
Importance of the MFI Indicator in the Financial Market
MFI as a momentum and volume oscillator
The Money Flow Index (MFI) serves as a valuable momentum and volume oscillator in the world of financial trading. But what does this mean, and why does it matter?
Momentum refers to the rate of change in a security's price over a specific period. Traders use momentum indicators to ascertain the strength of a market trend and identify potential reversal points. The MFI, much like other momentum oscillators such as the Relative Strength Index (RSI), oscillates between 0 and 100. Traders interpret values above 80 as overbought (signaling that the asset may be due for a price downturn), while values below 20 are considered oversold (indicating the asset may soon experience a price upturn). This oscillation provides a clear visual of momentum shifts in the market, serving as a vital tool for traders.
However, where the MFI stands out is in its inclusion of volume data. Volume refers to the number of shares or contracts traded within a specific period. High trading volumes typically indicate strong investor interest and validate a current price trend, while low volumes may suggest investor uncertainty or a weakening trend.
By incorporating volume, the MFI measures not only the rate of price changes but also the strength or intensity of these changes. This offers a more nuanced view of market dynamics. For instance, an increase in price accompanied by high volume is often a stronger bullish signal than an increase in price on low volume.
In summary, as a momentum and volume oscillator, the MFI provides a comprehensive insight into market behavior, combining the speed of price changes with the strength of those changes. This dual approach offers traders a more robust framework for interpreting market trends and potential reversal points.
Understanding the relationship between price and money flow
Understanding the relationship between price and money flow is crucial when using the Money Flow Index (MFI) as part of your trading strategy.
Price and money flow are intertwined in their influence on the MFI. Money flow refers to the net amount of a security's shares that are being bought or sold for a specific period, and it's calculated by multiplying the volume of shares traded by the typical price.
When more shares are being bought than sold, the money flow is positive, which can push the MFI higher. Conversely, when more shares are being sold than bought, the money flow is negative, which can cause the MFI to decrease.
The relationship between the two can indicate the strength and sustainability of a particular price movement. When the price of a security rises with increased volume (and thus, positive money flow), it suggests strong buying pressure and may indicate the start of an upward trend. Conversely, when the price drops with increased volume (and negative money flow), it implies strong selling pressure and may signal the start of a downward trend.
Divergences between price and money flow can also be significant. For instance, if the price is rising, but the MFI is falling (bearish divergence), it suggests that the upward price movement may be losing strength and could be about to reverse. Likewise, if the price is falling, but the MFI is rising (bullish divergence), it implies that the downward trend may be running out of steam and a price reversal could be imminent.
In summary, understanding the relationship between price and money flow through the MFI can provide valuable insights into market sentiment, the strength of price trends, and potential reversal points.
The MFI indicator's role in predicting market reversals
The Money Flow Index (MFI) plays a critical role in predicting market reversals, making it an essential tool for traders aiming to capitalize on these market dynamics. There are two primary ways in which the MFI can signal potential reversals: through overbought and oversold conditions, and through divergences.
1. Overbought and Oversold Conditions:
One of the most direct ways the MFI can signal potential market reversals is through identifying overbought and oversold conditions. In the context of the MFI:
- An overbought condition is typically represented by an MFI value above 80. This suggests that the security may be trading at a higher price than its intrinsic value, potentially indicating a reversal or downward price correction.
- An oversold condition is generally represented by an MFI value below 20. This indicates that the security may be trading at a lower price than its intrinsic value, implying a potential price rise or upward correction.
It's important to remember that while overbought and oversold signals are useful, they are not foolproof. Markets can remain overbought or oversold for extended periods, especially during strong trending conditions. Therefore, these signals are often used in conjunction with other technical indicators to confirm potential reversals.
2. Divergences:
The second way in which the MFI can signal potential market reversals is through divergences, which occur when the price of an asset and the MFI are not aligned:
- A bullish divergence occurs when the price of an asset is making new lows while the MFI is failing to make new lows. This suggests that selling pressure may be decreasing and a bullish reversal could be imminent.
- A bearish divergence happens when the price is making new highs while the MFI fails to make new highs. This signals that buying pressure may be decreasing, and a bearish reversal may be on the horizon.
Again, divergences are more effective when used alongside other technical indicators. They are excellent tools for identifying potential reversals, but they should not be used as standalone signals.
In summary, the MFI is a powerful tool for predicting market reversals. By identifying overbought and oversold conditions, and by spotting divergences, traders can use the MFI to make informed decisions and potentially capitalize on market reversals.

How to Interpret the MFI Indicator
Understanding the MFI scale (0-100)
The Money Flow Index (MFI) is plotted on a scale that ranges from 0 to 100, and it's designed to measure buying and selling pressure. Each point on this scale represents a specific market condition, and understanding what these values signify is crucial for interpreting the MFI effectively.
At the extremes of the scale:
An MFI of 0 signifies that all money flow is outflowing, meaning that there has been consistent selling pressure for the given period. This suggests that all trading activity has involved selling of the security, implying the market is potentially deeply oversold. However, it's important to note that this is a rare occurrence.
An MFI of 100 signifies that all money flow is inflowing, meaning that there has been consistent buying pressure for the period. This suggests that all trading activity has involved buying of the security, indicating the market is potentially deeply overbought. This is also a relatively rare scenario.
In between these extremes, the values indicate varying degrees of buying and selling pressure:
An MFI between 0 and 20 typically indicates that the security is oversold, signaling that it might be undervalued and hence a good buying opportunity. However, caution should be exercised, as a continuing downward trend might still result in losses.
An MFI between 80 and 100 typically suggests the security is overbought. This can often be a signal that the security might be overvalued, and hence it could be a good time to sell. However, like with oversold conditions, one should be cautious as the price might continue to rise, especially in strongly trending markets.
An MFI between 20 and 80 signals normal trading activity with no strong indications of being either overbought or oversold.
Understanding the MFI scale is essential for traders as it offers insights into potential trend reversals and can help identify good entry and exit points. However, it is vital to combine MFI with other technical analysis tools for a more comprehensive market analysis, and not to rely solely on the MFI as it can sometimes give false signals.
Overbought and oversold conditions
In the context of the Money Flow Index (MFI), the terms "overbought" and "oversold" represent specific market conditions that may suggest upcoming price reversals. Here's what they mean and how to interpret them:
Overbought Conditions:
An "overbought" condition is typically represented by an MFI value above 80. This means that the price of the asset has been increasing rapidly, and there might be a disproportionate amount of buying compared to what is sustainable in the longer term. An overbought condition can suggest that the asset's price is higher than its intrinsic value, potentially due to euphoria or optimistic buying.
Although an overbought condition might be an early sign of a possible downward correction or trend reversal, it's important to understand that an overbought market can stay overbought for a long time, especially during a strong uptrend. Hence, an overbought condition alone is not a definitive sell signal, but it indicates that traders should proceed with caution and look for other confirming signals.
Oversold Conditions:
An "oversold" condition is typically represented by an MFI value below 20. This means that the price of the asset has been falling, and there might be a disproportionate amount of selling compared to what is sustainable over the long term. An oversold condition can suggest that the asset's price is lower than its intrinsic value, potentially due to panic selling or pessimistic sentiment.
Just like overbought conditions, oversold conditions might be an early sign of a possible upward correction or trend reversal. However, an oversold market can remain oversold for a long time, especially during a strong downtrend. Therefore, an oversold condition alone is not a definitive buy signal but indicates that traders should proceed with caution and look for other confirming signals.
It's crucial to use overbought and oversold conditions as part of a broader analytical framework, including other technical indicators and fundamental analysis, to make more reliable trading decisions.
Divergence between price and MFI
Divergence between the Money Flow Index (MFI) and price action is a significant signal that traders often look for as it can indicate potential market reversals. A divergence occurs when the price trend of a security moves in the opposite direction to the trend of the MFI.
1. Bullish Divergence
A bullish divergence happens when the price of a security is making lower lows (a continuing downward trend), but the MFI is making higher lows (indicating less selling pressure or increased buying pressure). This divergence could suggest that the downward price trend is losing momentum and a bullish reversal (upward price movement) may be imminent.
However, it's important to remember that bullish divergences should be confirmed with other indicators or price patterns before taking action, as they can often provide false signals if relied upon exclusively.
2. Bearish Divergence
A bearish divergence occurs when the price is making higher highs (an ongoing upward trend), but the MFI is making lower highs (indicating less buying pressure or increased selling pressure). This divergence could suggest that the upward price trend is losing momentum and a bearish reversal (downward price movement) may be on the horizon.
As with bullish divergences, bearish divergences should be confirmed with other indicators or price patterns before taking action, as they can sometimes provide false signals if relied upon exclusively.
In conclusion, while divergence between price and the MFI can be a powerful signal of potential reversals, it's crucial to use it in conjunction with other technical analysis tools to increase its reliability and effectiveness.
Practical Usage of the MFI Indicator in Trading
Using the MFI Indicator for Generating Trading Signals
Overbought/Oversold Signals: When the MFI surpasses 80, it could be an indication that the asset is overbought and may experience a price decline or reversal. Conversely, if the MFI drops below 20, it suggests the asset may be oversold and could see a price rise or reversal.
Divergence Signals: Bullish divergence (price making lower lows while MFI makes higher lows) and bearish divergence (price making higher highs while MFI makes lower highs) could indicate upcoming reversals.
Trend Confirmation: When the MFI aligns with the current price trend, it can confirm the strength of that trend. For instance, in a strong uptrend, the MFI should also trend upwards and usually stay above the 50 mark.
Applying the MFI Indicator for Risk Management
Stop-Loss Placement: MFI can guide stop-loss placement. For instance, in a long position, if the MFI begins to decline and drops below a predetermined level (e.g., 50 or 80), it might be time to close the position to limit potential losses.
Risk/Reward Evaluation: By identifying overbought and oversold conditions, the MFI can help determine whether the potential reward of entering a trade outweighs the risk. For example, entering a long position when an asset is in an oversold condition may provide a favorable risk/reward scenario.
Combining the MFI Indicator with Other Technical Analysis Tools
With Trend Lines and Chart Patterns: Confirming MFI signals with trend lines and chart patterns can increase their reliability. For example, a bullish MFI divergence accompanied by a price breakout from a bullish chart pattern could reinforce the bullish signal.
With Other Indicators: Combining MFI with other momentum indicators (like RSI, MACD) or volume indicators can provide a more comprehensive view of the market conditions.
With Fundamental Analysis: For best results, combine the MFI with fundamental analysis. For instance, an oversold signal from the MFI could be a good buying opportunity, but only if the fundamentals of the asset are strong.
Remember, while the MFI can be a valuable tool, no indicator is foolproof. Always use it as part of a broader trading strategy that considers multiple indicators and market context.
Tips and Strategies for Maximizing the Effectiveness of the MFI Indicator
Best Practices for Using the MFI Indicator
Use in Conjunction with Other Indicators: While the MFI is a powerful tool, it should not be used in isolation. Use it in combination with other technical analysis tools, like trend lines, moving averages, or other momentum indicators, to validate signals and increase accuracy.
Consider the Market Context: Always interpret the MFI in light of the broader market context. An overbought signal in a strong uptrend may just signify a healthy pause before the uptrend resumes. Always take note of the broader trend before making decisions based on the MFI.
Patience and Confirmation: Wait for confirmation of signals from the MFI before making trading decisions. It is easy to misinterpret a signal if it is acted upon too hastily.
Trading Strategies That Can Leverage the MFI Indicator
Trend Trading: The MFI can help to confirm the strength of a trend. If the price is moving up and the MFI is above 50 and rising, this confirms the upward trend. Likewise, if the price is moving down and the MFI is below 50 and falling, this confirms the downward trend.
Reversal Trading: Look for divergences between the MFI and price to signal potential price reversals. For instance, if the price is making higher highs while the MFI is making lower highs, this bearish divergence could indicate a possible downward price reversal.
Overbought/Oversold Trading: Use the MFI to identify potential overbought or oversold conditions that could lead to price reversals. Remember, an overbought condition doesn't necessarily mean "sell," nor does an oversold condition immediately mean "buy." Use these signals as potential early warnings of a reversal and confirm with other indicators.
How to Avoid Common Mistakes When Using the MFI Indicator
Ignoring Overbought/Oversold Duration: Just because an asset is in an overbought or oversold condition doesn't mean a price reversal will happen immediately. An asset can stay overbought or oversold for an extended period. Traders should wait for additional confirmation of a reversal before acting.
Misinterpreting Divergences: Not all divergences result in price reversals. Sometimes, a divergence can simply indicate the slowing down of the current trend, not necessarily a reversal. Confirm divergence signals with other indicators or price patterns before making a decision.
Ignoring Volume: Since MFI is a volume-weighted indicator, ignoring volume can lead to misinterpretation. Be aware of periods of high and low volume, as they can greatly affect the MFI. For instance, low-volume periods may result in less reliable MFI signals.
Neglecting Fundamental Analysis: While technical analysis and indicators like MFI are essential tools for trading, they should be used in conjunction with fundamental analysis for a more comprehensive view of the market. Ignoring fundamentals can lead to poor decision-making.
Conclusion
Recap of the Importance and Applications of the MFI Indicator
In conclusion, the Money Flow Index (MFI) is an invaluable tool in the world of financial trading. It combines both price and volume data to provide a comprehensive view of money flowing into and out of a security. By helping to identify overbought and oversold conditions, predicting potential price reversals through divergences, and confirming trends, the MFI plays a critical role in crafting effective trading strategies.
Understanding the intricacies of the MFI, such as its components, calculation, and scale, is key to leveraging its insights. Moreover, applying the MFI effectively in real-world trading scenarios involves its integration with other technical analysis tools and methodologies. It also requires a keen understanding of the common mistakes to avoid when using the indicator and the best practices to follow for maximum effectiveness.
Encouragement for Further Study and Practical Application of MFI
While we've explored the MFI in detail in this article, learning how to use the MFI indicator effectively involves practical application. As with all trading tools, proficiency comes with experience. Therefore, we encourage you to apply what you've learned in a controlled and risk-managed setting, such as a trading simulator, before utilizing the MFI in live trading.
Furthermore, the MFI is just one of many technical indicators available to traders. To become a well-rounded trader, you should aim to familiarize yourself with a broad range of tools and indicators, understanding how each one complements the others. In doing so, you'll be better equipped to develop a robust trading strategy that can navigate the myriad of conditions the market can present.
Keep in mind that trading involves risk and is not suitable for everyone. Make sure to continue your education, stay updated with market news, and always manage your risk appropriately. Your journey into the financial markets is a marathon, not a sprint, and every piece of knowledge you acquire, such as understanding the MFI, brings you one step closer to your trading goals.


