See also


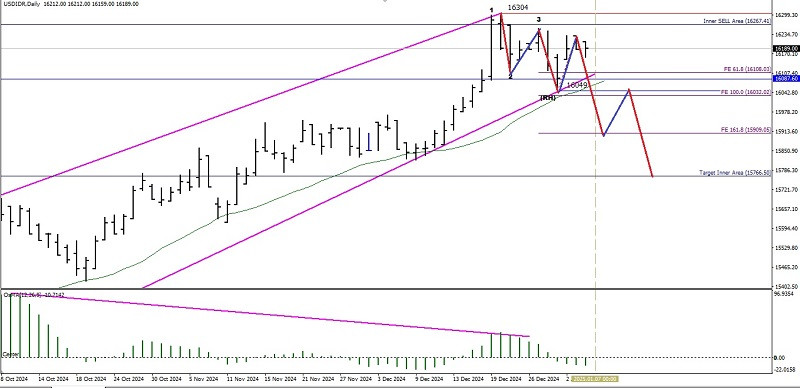
With the appearance of the Raising Wedge pattern which also confirms the occurrence of a deviation between the USD/IDR price movement and the MACD Histogram (osMA) indicator, even though the price movement is still above the WMA (30 Shift 2), but as long as the USD/IDR does not continue its strengthening until it breaks above the 16304 level, then the USD/IDR has the potential to test the 16049 level which is the Ross Hook (RH) level and if this level is successfully breaks and closes below it, the USD/IDR has the potential to continue its weakening to the 15909.05 level and if the momentum of the weakening and its volatility support it, then 15766.50 will be the next target to be targeted next.
(Disclaimer)
You have already liked this post today
*The market analysis posted here is meant to increase your awareness, but not to give instructions to make a trade.


