See also


 03.02.2023 10:15 AM
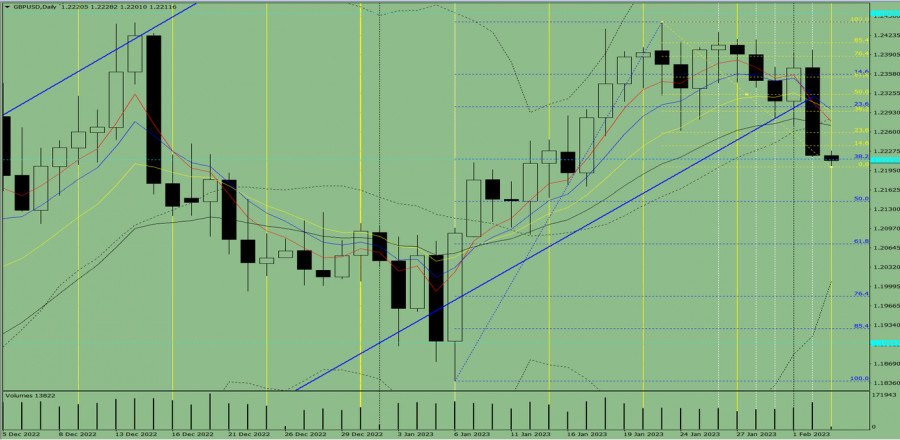
Trend analysis (Fig. 1).
The pound-dollar pair may move downward from the level of 1.2221 (closing of yesterday's daily candle) to 1.2143, the 50% pullback level (blue dotted line). Upon reaching this level, the price may move up.
Fig. 1 (daily chart).
Comprehensive analysis:
General conclusion:
Today, the price may move downward from the level of 1.2221 (closing of yesterday's daily candle) to 1.2143, the 50% pullback level (blue dotted line). Upon reaching this level, the price may move up.
Alternatively, the price may move upward from the level of 1.2221 (closing of yesterday's daily candle) to 1.2259, the 23.6% pullback level (yellow dotted line). Upon reaching this level, the price may continue to move up.
You have already liked this post today
*The market analysis posted here is meant to increase your awareness, but not to give instructions to make a trade.
From what is seen on the 4-hour chart, the EUR/GBP cross currency pair appears to be moving above the EMA (100), which indicates that Buyers dominate the currency pair
With the appearance of Convergence between the price movement of the main currency pair USD/JPY with the Stochastic Oscillator indicator and the position of the EMA (100) which is above
Useful links: My other articles are available in this section InstaForex course for beginners Popular Analytics Open trading account Important: The begginers in forex trading need to be very careful
Useful links: My other articles are available in this section InstaForex course for beginners Popular Analytics Open trading account Important: The begginers in forex trading need to be very careful
From what we see on the 4-hour chart of the Nasdaq 100 index, there are several interesting things, namely, first, the price movement is moving below the MA (100), second
Early in the American session, gold is trading around 3,312 with a bullish bias after breaking out of the symmetrical triangle. Gold is now likely to continue rising
Your IP address shows that you are currently located in the USA. If you are a resident of the United States, you are prohibited from using the services of InstaFintech Group including online trading, online transfers, deposit/withdrawal of funds, etc.
If you think you are seeing this message by mistake and your location is not the US, kindly proceed to the website. Otherwise, you must leave the website in order to comply with government restrictions.
Why does your IP address show your location as the USA?
Please confirm whether you are a US resident or not by clicking the relevant button below. If you choose the wrong option, being a US resident, you will not be able to open an account with InstaTrade anyway.
We are sorry for any inconvenience caused by this message.

