See also


 14.08.2023 10:30 AM
The sudden growth of the UK's GDP by 0.2% in the second quarter compared to the previous three months was unexpected for analysts who anticipated a zero change in the rate. This coincided with the release of data on the country's industrial production, which reached its highest level in three years. In June 2023, industrial production grew by 1.8% compared to the previous month, recovering from a 0.6% decline in the prior month. This significant surge in industrial activity exceeded market expectations by 0.1% and was the best since August 2020.
During the American trading session, producer prices in the United States were published, which in July rose above forecasts. These results indicate the possibility of further growth in the level of inflation in the U.S. In turn, the Federal Reserve might ultimately continue to raise interest rates. All these led to further strengthening of the dollar's positions in the market.
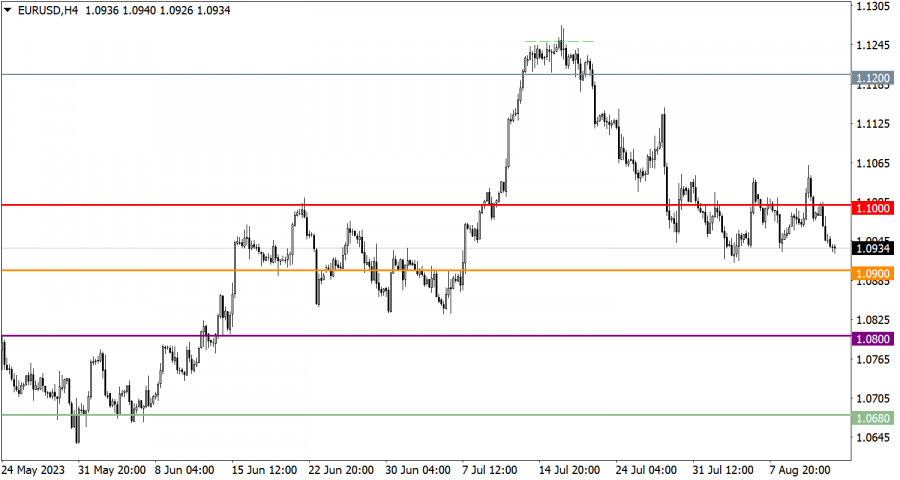
The EUR/USD currency pair again returned to the local low of the correction cycle during a rapid downward movement. This price movement indicates the possibility of further decline if a set of technical conditions aligns.
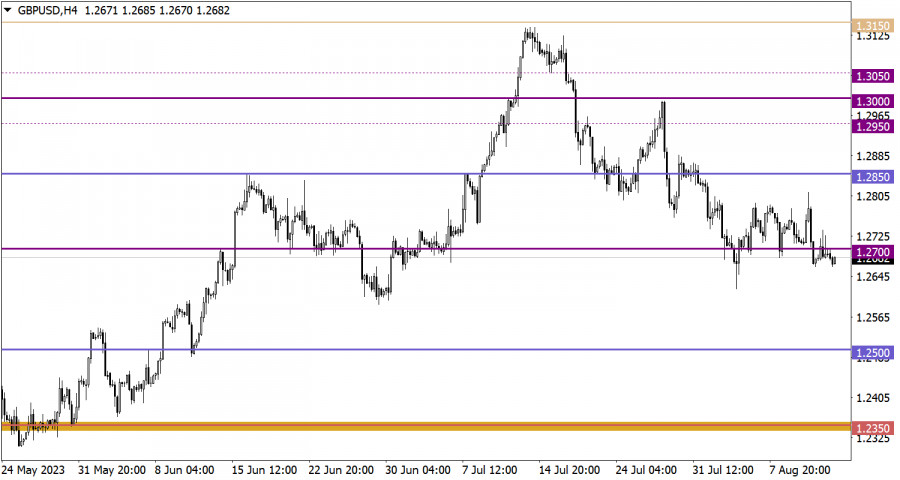
The GBP/USD currency pair maintains a downward sentiment despite a recent stagnation. Holding the price below the 1.2700 level suggests a prolongation of the correction cycle, although such a technical signal is absent at this stage.
Monday, as usual, is accompanied by an empty macroeconomic calendar. No major statistical data releases are expected in the European Union, the United Kingdom, or the United States.
In this context, investors and traders are likely to rely on incoming news and information flows to make market decisions.
For a further increase in the volume of short positions, it is essential to stay below the 1.0900 level. In this scenario, there could be a sequential weakening of the euro, leading it to reach values around 1.0850 or 1.0800. An alternative scenario contemplates a price rebound from the 1.0900 level, similar to the previous movement that occurred on August 3.
For a further increase in the volume of short positions, it's enough for the price to drop below the 1.2650 level. If such a movement occurs, there's a high probability of the continuation of the current corrective downward movement. However, until then, there's a possibility that the exchange rate will form a stagnation (sideways movement) near the 1.2700 level.
The candlestick chart type is white and black graphic rectangles with lines above and below. With a detailed analysis of each individual candle, you can see its characteristics relative to a particular time frame: opening price, closing price, intraday high and low.
Horizontal levels are price coordinates, relative to which a price may stop or reverse its trajectory. In the market, these levels are called support and resistance.
Circles and rectangles are highlighted examples where the price reversed in history. This color highlighting indicates horizontal lines that may put pressure on the asset's price in the future.
The up/down arrows are landmarks of the possible price direction in the future.
You have already liked this post today
*The market analysis posted here is meant to increase your awareness, but not to give instructions to make a trade.
Analysis of Thursday's Trades 1H Chart of GBP/USD On Thursday, the GBP/USD pair showed movements similar to the EUR/USD pair but with lower volatility. The ascending trendline was breached
Analysis of Thursday's Trades 1H Chart of EUR/USD The EUR/USD currency pair started Thursday with a sharp collapse but spent the rest of the day trading with strong growth. Explaining
The GBP/USD currency pair showed lower volatility on Thursday than the EUR/USD pair, which is quite surprising. At the same time, the British pound recovered without much difficulty
The EUR/USD currency pair plunged sharply overnight on Thursday but posted a threefold stronger rally throughout the day. The overnight movement was triggered by a single event: the U.S. Court

Your IP address shows that you are currently located in the USA. If you are a resident of the United States, you are prohibited from using the services of InstaFintech Group including online trading, online transfers, deposit/withdrawal of funds, etc.
If you think you are seeing this message by mistake and your location is not the US, kindly proceed to the website. Otherwise, you must leave the website in order to comply with government restrictions.
Why does your IP address show your location as the USA?
Please confirm whether you are a US resident or not by clicking the relevant button below. If you choose the wrong option, being a US resident, you will not be able to open an account with InstaTrade anyway.
We are sorry for any inconvenience caused by this message.


