See also

 26.09.2024 06:17 AM
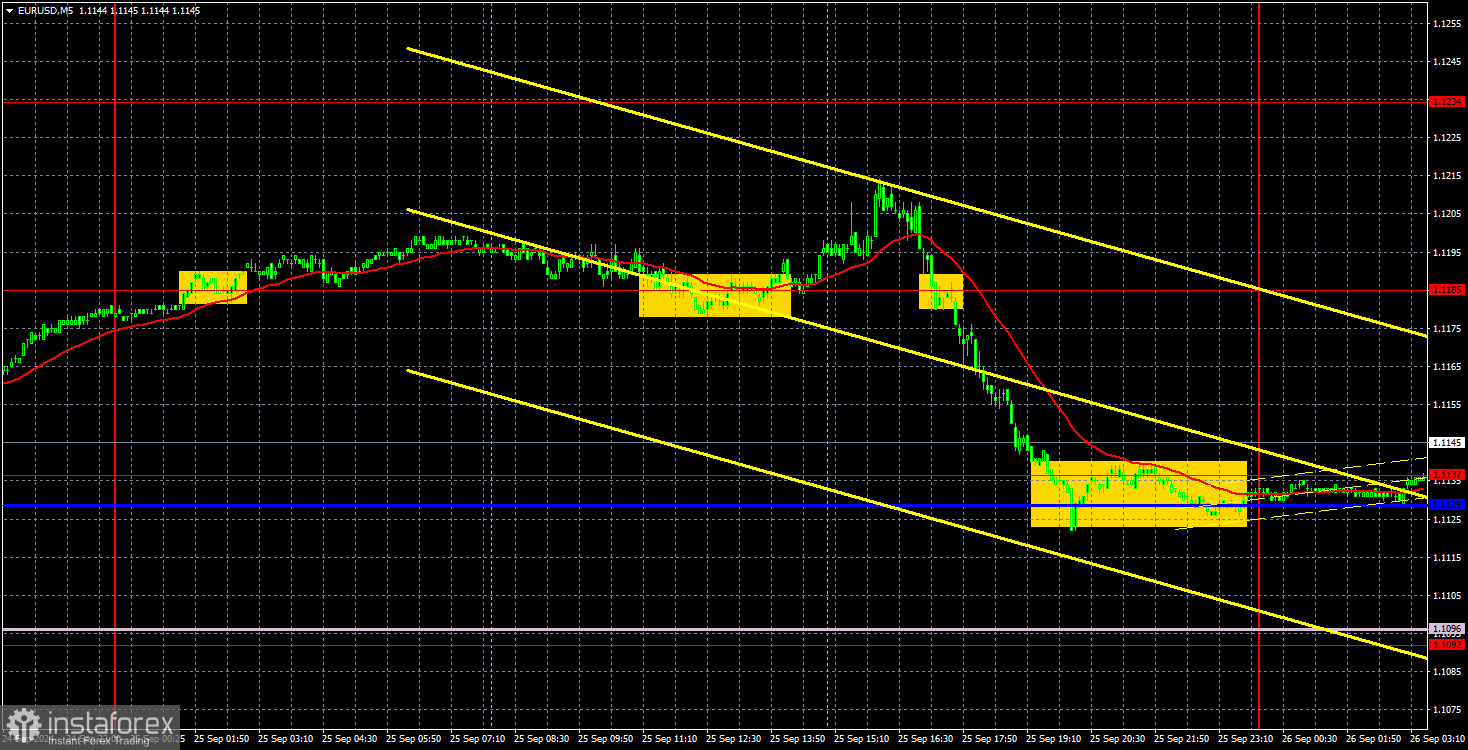
The EUR/USD pair showed a reasonably substantial decline on Wednesday, which is somewhat encouraging. There were no significant macroeconomic or fundamental factors on Wednesday (if you don't count entirely secondary events), so the decline occurred purely due to technical reasons. As we can see, the price is currently inside an ascending channel and is responding well to its boundaries. The slope of the channel is relatively small, indicating the bulls' weakness in the market. In our view, the market has already largely priced in all the factors contributing to the decline of the US dollar, so it's time to start a new downward trend. However, the price might continue to rise for a while due to momentum. The market still eagerly takes every opportunity to sell the dollar, and next week, crucial data on the US labor market and unemployment will be published. Therefore, the pair may still show growth.
From a technical perspective, breaking the upward trend would require the price to consolidate below the ascending channel and the Ichimoku indicator lines. That means the upward trend can be considered over if the price drops below the 1.1100 level. We still don't see any basis for the euro to continue its medium-term growth if both central banks simultaneously lower rates.
There were several trading signals on Wednesday. Initially, the price formed two buy signals around the 1.1185 level, duplicating each other. However, the price only moved 20 pips in the intended direction. Therefore, the trade might have closed at breakeven with a Stop Loss. Next, there was a sell signal around the same level of 1.1185, after which the price dropped to the critical line, where the trade could be closed. The profit amounted to around 45 pips.
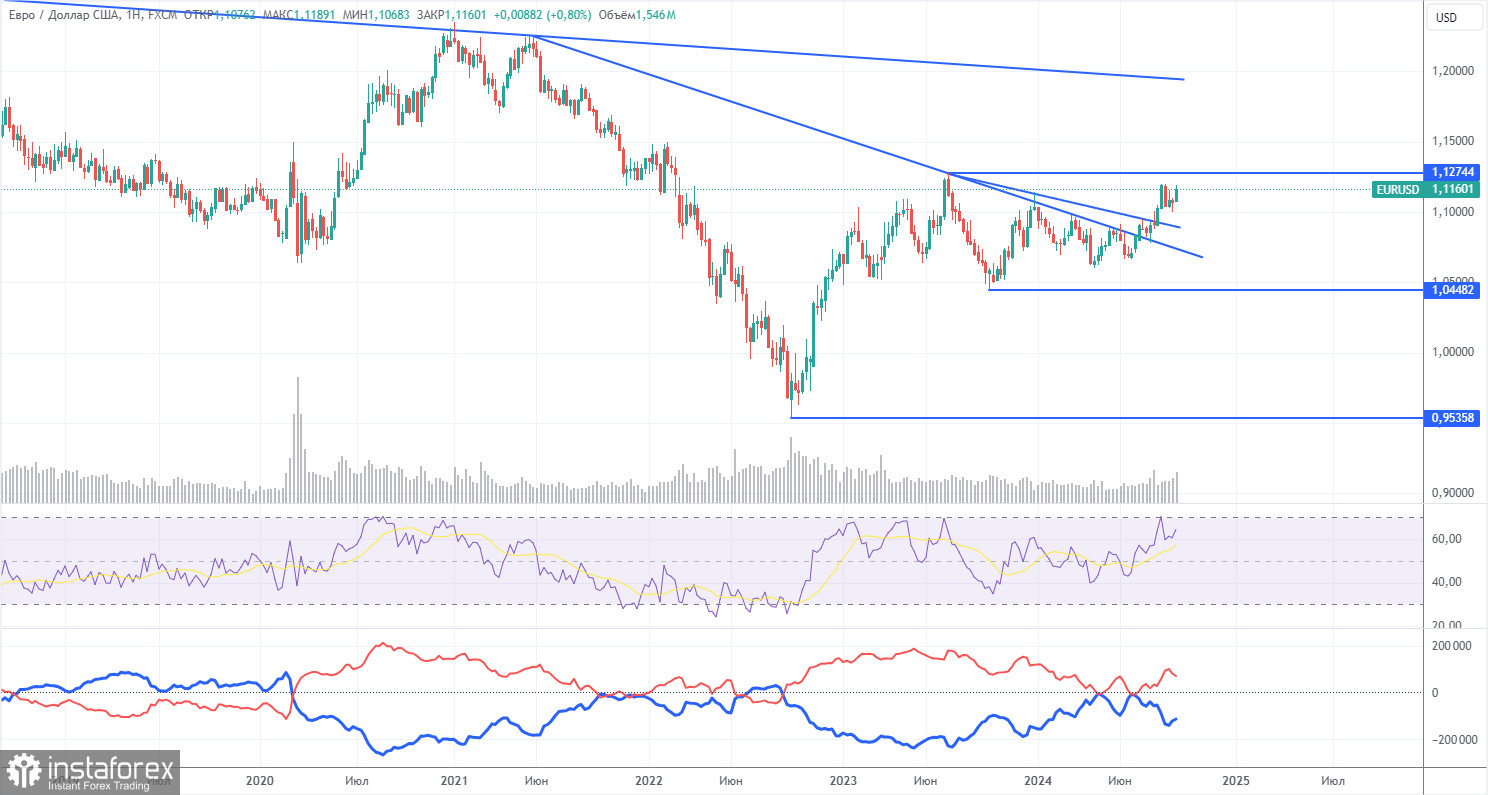
The latest COT report is dated September 17. The illustration above clearly shows that the net position of non-commercial traders has long remained bullish. The bears' attempt to gain dominance failed spectacularly. The net position of non-commercial traders (red line) declined in the second half of 2023 and the first half of 2024, while commercial traders (blue line) increased. Currently, professional players are once again building long positions.
We still don't see any fundamental factors supporting the strengthening of the European currency, and technical analysis suggests that the price is in a consolidation zone—in simpler terms, in a flat market. In the weekly time frame, it's clear that since December 2022 (!!!), the pair has been trading between 1.0448 and 1.1274. In other words, we've moved from a seven-month flat range to an 18-month one.
The red and blue lines are diverging, indicating an increase in long positions on the euro. However, such changes cannot serve as a basis for long-term conclusions within a flat range. During the latest reporting week, the number of longs for the non-commercial group decreased by 10,500, while the number of shorts increased by 1,200. Consequently, the net position decreased by 11,700. The potential for a decline in the euro remains intact.
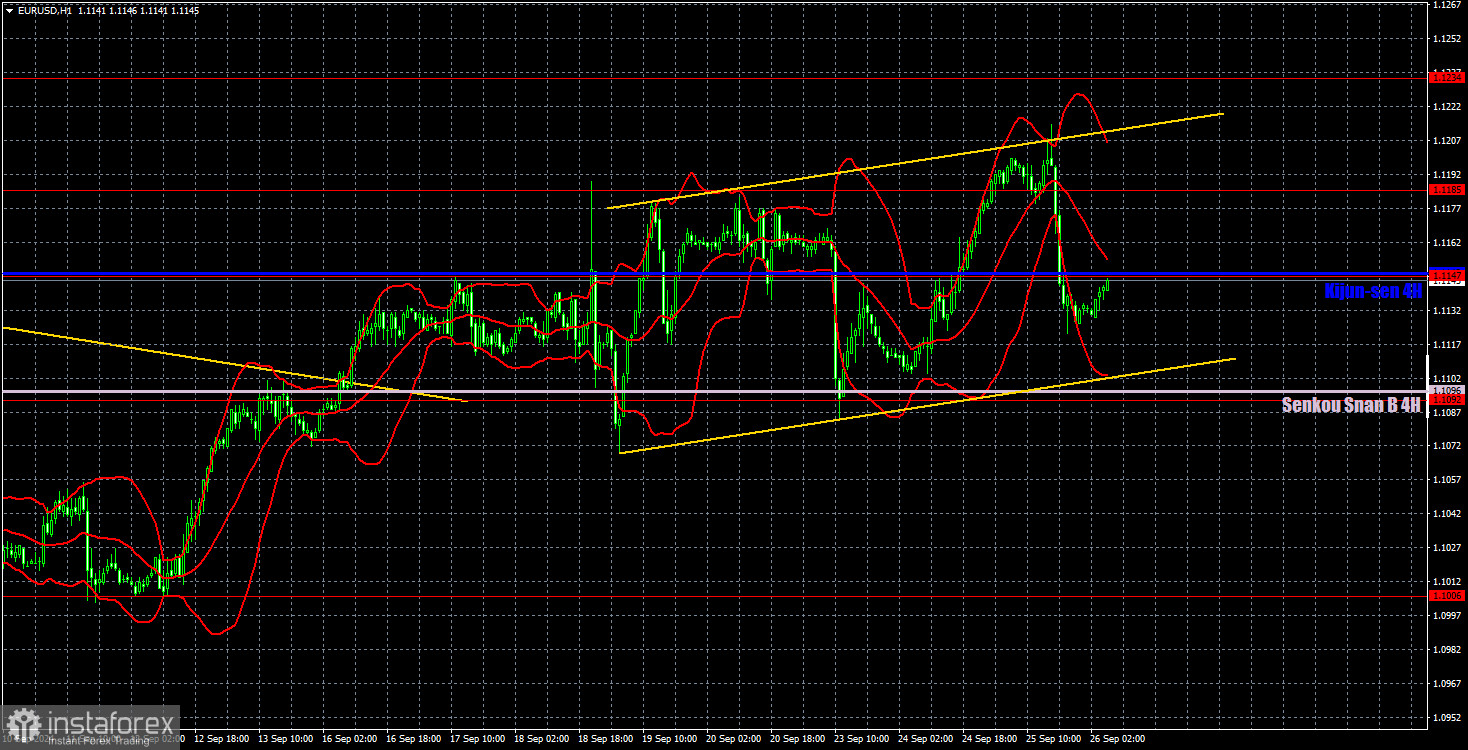
In the hourly time frame, the pair has real chances of ending the baseless upward trend that has lasted for two years. There's no point in talking about the fundamental and macroeconomic reasons for a new decline in the dollar – they don't exist. More accurately, the market only "sees" the news that suggests selling the dollar. Corrections occur occasionally, but they don't change the fact that the euro continues to rise overall, and this rise is unfounded.
For September 26, we highlight the following levels for trading: 1.0658-1.0669, 1.0757, 1.0797, 1.0843, 1.0889, 1.0935, 1.1006, 1.1092, 1.1147, 1.1185, 1.1234, 1.1274, as well as the Senkou Span B (1.1096) and Kijun-sen (1.1149) lines. The Ichimoku indicator lines can move throughout the day, so this should be considered when identifying trading signals. Remember to set a Stop Loss order to break even if the price moves 15 pips in the intended direction, as this will protect you from possible losses if the signal turns out to be false.
On Thursday, pay attention to the US reports on GDP and durable goods orders, as well as Christine Lagarde's and Jerome Powell's speeches. These are four fairly important events, each of which could provoke a market reaction. Market participants will likely again be looking for a reason to sell the US dollar.
Support and resistance price levels: thick red lines, where the movement may end. They are not sources of trading signals.
Kijun-sen and Senkou Span B lines: lines of the Ichimoku indicator transferred to the hourly time frame from the 4-hour one. They are strong lines.
Extreme levels: thin red lines from which the price has previously bounced. These are sources of trading signals.
Yellow lines: trend lines, trend channels, and any other technical patterns.
Indicator 1 on COT charts: the net position size of each trader category.
You have already liked this post today
*The market analysis posted here is meant to increase your awareness, but not to give instructions to make a trade.


