See also


GOLD
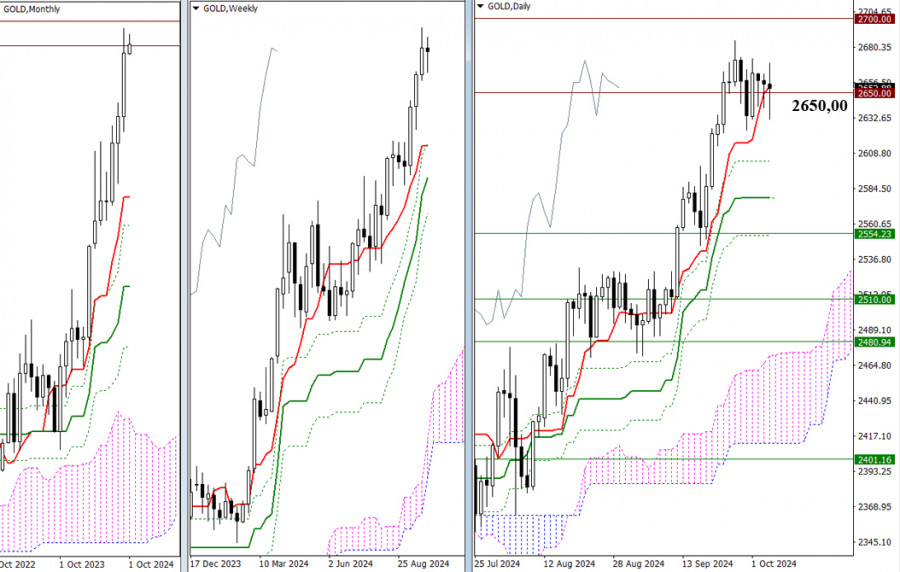
The first week of October saw gold in a state of hesitation and uncertainty. Two levels served as the center of attraction for almost the entire week: the daily short-term trend (2653.63) and the psychological threshold (2650.00), tested earlier. The bears lacked the strength to continue the downward correction that began in the last days of September. However, if they break out of the consolidation zone, their first downside target will be the support of the daily Ichimoku cross (2603.46 – 2578.24 – 2553.02). It's also important to note that the weekly short-term trend will soon shift upwards to the level of 2554.23, which will strengthen the daily support. If the bulls emerge victorious from the current uncertainty, there are no historical benchmarks for gold at this section of the chart, so attention can shift to psychological "round" levels, such as 2700.00 – 2750.00 – 2800.00.
H4 – H1
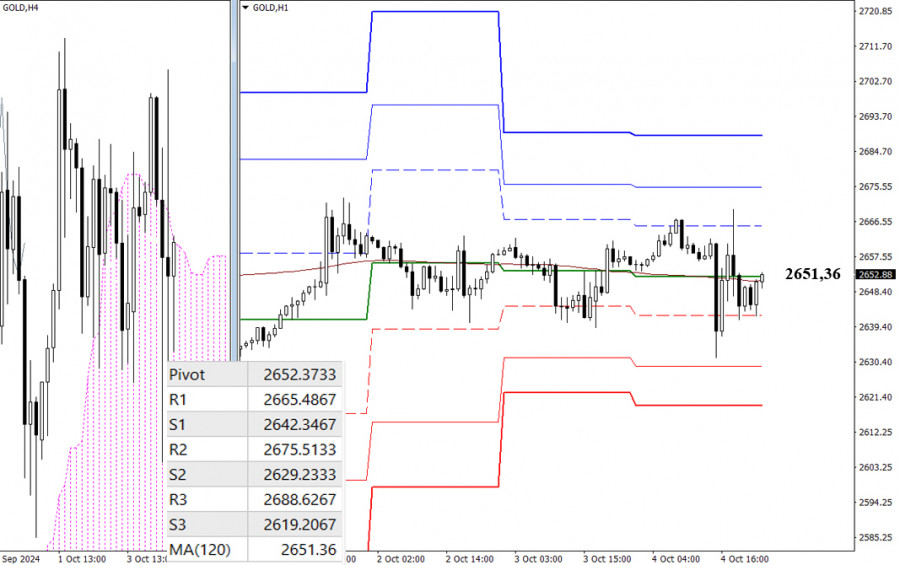
The consolidation on the higher time frames has caused the key levels on the lower time frames to merge around 2652.37 – 2651.36 (central Pivot level of the day), creating a horizontal alignment and allowing the market to revolve around these levels. If the uncertainty persists, the current placement of key levels will remain unchanged. However, if the market manages to break out of the consolidation zone, the support and resistance of the classic Pivot levels will guide intraday directional movement. New Pivot level values to focus on will be set at the opening of the new trading week.
Technical analysis tools used:
You have already liked this post today
*The market analysis posted here is meant to increase your awareness, but not to give instructions to make a trade.


