See also


 02.01.2025 01:13 PM
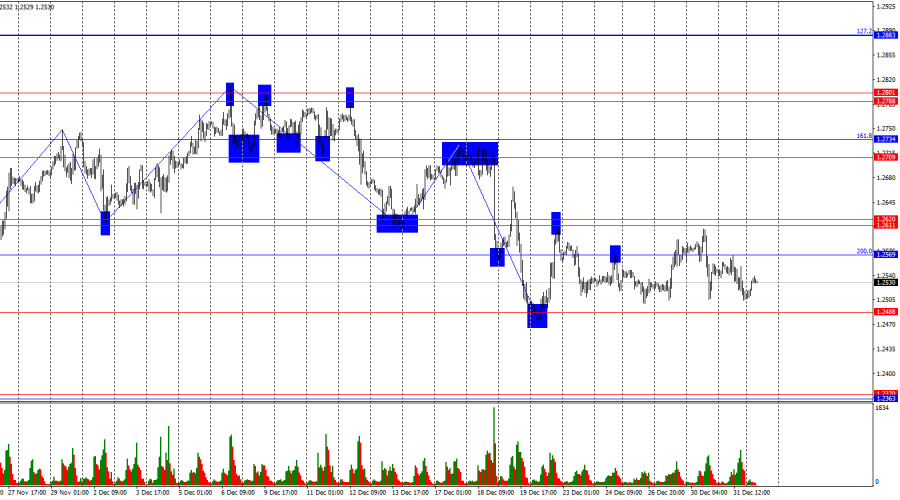
The wave situation poses no questions. The last completed wave upward did not break the peak of the previous wave, while the last completed wave downward broke the previous low. Thus, a new bearish trend is currently forming. For this trend to conclude, the pound must rise to at least the 1.2709–1.2734 zone.
On Tuesday, the economic calendar did not include any significant events. Therefore, neither bears nor bulls have reasons to open new positions. As a result, the pair remains in the range and is unable or unwilling to break out. The chances of the range breaking today are very slim, given the weak information background. In any case, we must first wait for the breakout of the horizontal channel before assessing the situation. Until the breakout, the optimal strategy remains trading on the rebound from the range boundaries. Currently, the pound is near the lower boundary of the range—a rebound is possible. However, this is already the sixth attempt by bears to break below the range and continue forming the trend. The chances of a new pound decline are increasing.
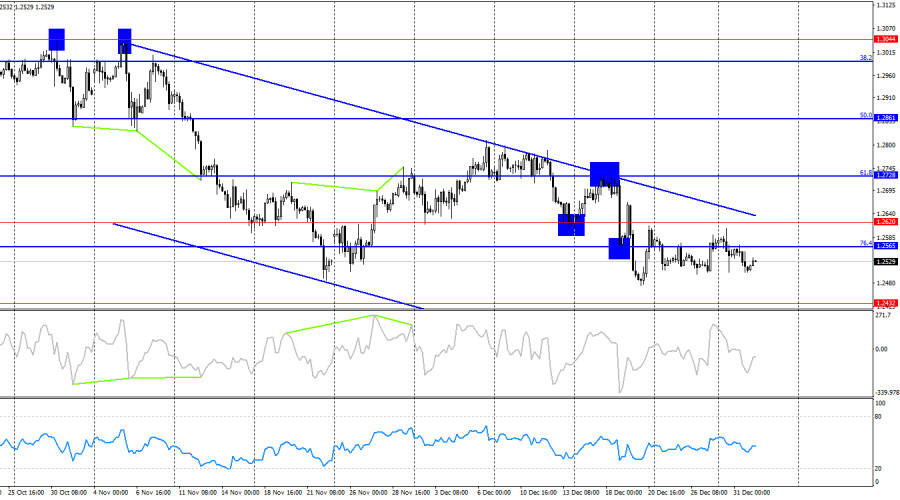
On the 4-hour chart, the pair returned to the 76.4% corrective level at 1.2565. However, the range on the hourly chart is more important than the chart pattern on the 4-hour timeframe. The downward trend channel indicates the dominance of bears, who are unlikely to lose their edge anytime soon. Only a close above the channel would suggest a strong rise for the pound.
Commitments of Traders (COT) Report:
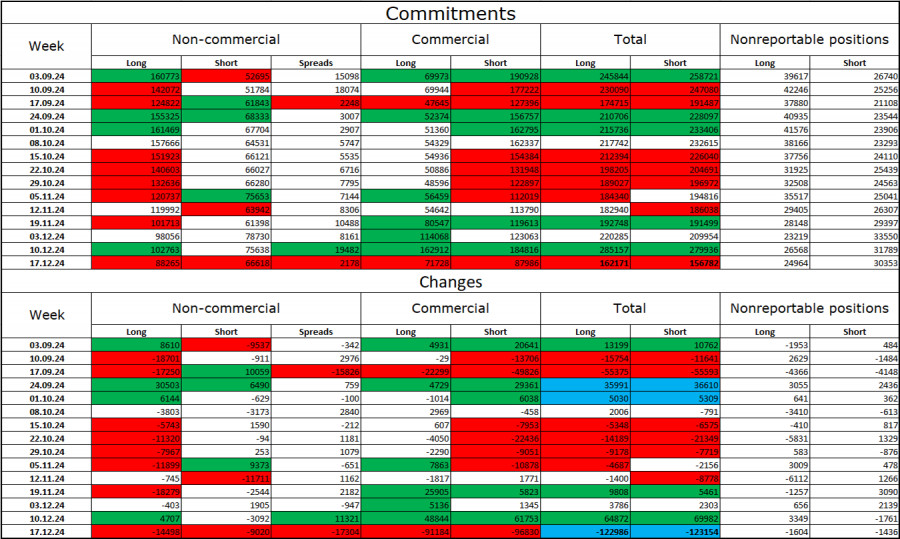
The sentiment of the "Non-commercial" category of traders has hardly changed over the last reporting week. The number of long positions held by speculators increased by 4,707, while short positions decreased by 3,092. Bulls still have the advantage, but this has been fading in recent months. The gap between the number of long and short positions is now just 27,000: 102,000 versus 75,000.
In my view, the pound's prospects for a decline remain intact, and the COT reports signal growing bearish positions almost every week. Over the past three months, the number of long positions has dropped from 160,000 to 102,000, while short positions have risen from 52,000 to 75,000. I believe professional players will continue to reduce long positions or increase shorts over time, as all possible factors for buying the British pound have already been priced in. Technical analysis also supports the pound's decline.
Economic Calendar for the UK and the US:
On Thursday, the economic calendar includes several entries, but none are particularly significant. The impact of the informational background on trader sentiment today may be very weak.
Forecast for GBP/USD and Trading Tips:
Fibonacci Levels:
You have already liked this post today
*The market analysis posted here is meant to increase your awareness, but not to give instructions to make a trade.
Useful links: My other articles are available in this section InstaForex course for beginners Popular Analytics Open trading account Important: The begginers in forex trading need to be very careful
Given that the eagle indicator is showing potential for a possible recovery for the euro, we will look for buying opportunities whenever the euro pulls back and trades above 1.1596
If Bitcoin makes a technical correction toward the support at 118,750 or the secondary uptrend channel around 118,200 in the coming hours, this will be seen as a buying opportunity
Conversely, if gold falls below 3,320 and breaks the uptrend channel, we could expect a trend reversal, and it may reach the 4/8 Murray line at 3,281, eventually reaching
XAU/USD – Friday, July 18, 2025. The potential for XAU/USD to weaken continues, as reflected in The EMA (50) is below the EMA (200) and the RSI (14)
Your IP address shows that you are currently located in the USA. If you are a resident of the United States, you are prohibited from using the services of InstaFintech Group including online trading, online transfers, deposit/withdrawal of funds, etc.
If you think you are seeing this message by mistake and your location is not the US, kindly proceed to the website. Otherwise, you must leave the website in order to comply with government restrictions.
Why does your IP address show your location as the USA?
Please confirm whether you are a US resident or not by clicking the relevant button below. If you choose the wrong option, being a US resident, you will not be able to open an account with InstaTrade anyway.
We are sorry for any inconvenience caused by this message.


