Voir aussi


 20.01.2023 07:10 PM
The expected trend for today: Bullish.
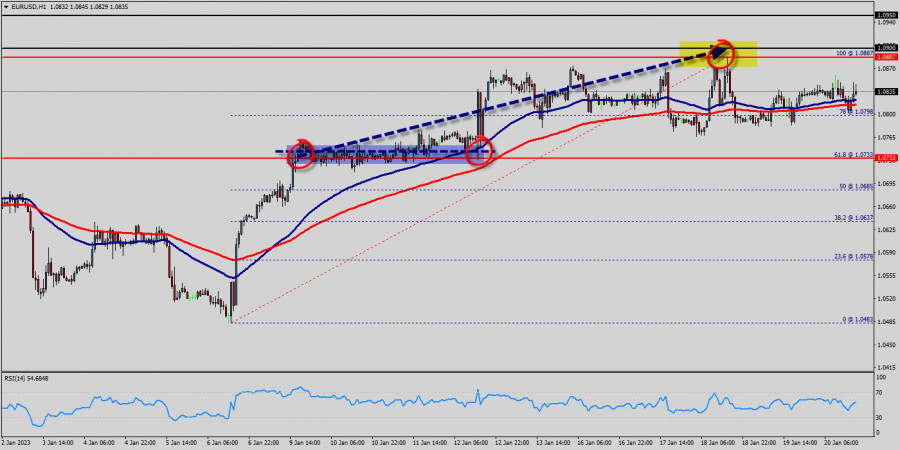
The EUR/USD pair rallied upwards strongly yesterday to breach the bearish channel's resistance and settles above it, opening the way to turn to the upside on the intraday and short-term basis, starting bullish correction for the raise measured from 1.0733 to 1.0835, noting that the first main station is located at 1.0887, which breaching it represents the key to achieve additional gains that reach 1.0900.
Therefore, the bullish bias will be suggested for today, supported by the EMA100 that carries the price from above, taking into consideration that breaking 1.0835 will stop the expected rise and push the price back to the main bearish track again.
A medium term topped could be in place already, on bullish convergence condition in daily RSI.
Intraday bias is now on the upside for 61.8% retracement of 1.0733 to 1.0835 at 1.0887. The EUR/USD pair traded higher and closed the day in the positive territory around 1.0835-1.0887.
On the hourly chart, EUR/USD is still trading above the moving average line MA (100) H1 (1.0835).
Accordingly, the bullish outlook remains the same as long as the EMA 100 is pointing to the uptrend. This suggests that the pair will probably go above the daily pivot point (1.0835) in the coming hours.
The EUR/USD pair will demonstrate strength following a breakout of the high at 1.0835 . The situation is similar on the four-hour chart. Based on the foregoing, it is probably worth sticking to the north direction in trading, and as long as the EUR/USD pair remains above MA100 H1, it may be necessary to look for entry points to buy for the formation of a correction. Probably, the main scenario is continued growth towards 1.0887 (Oct. 26 high). The expected trading range for today is between 1.0733 support and 1.0900 resistance.
Forecast:
Uptrend scenario :
An uptrend will start as soon, as the market rises above resistance level 1.0733, which will be followed by moving up to resistance level 1.0887. Further close above the high end may cause a rally towards 1.0887and 1.0900. Nonetheless, the weekly resistance level and zone should be considered at 1.0900.
Alternative scenario :
On the downside, break of 1.0733 major
support will turn intraday bias neutral first. The breakdown of 1.0733 will allow the pair to down further down to the prices of 1.0700 and 1.0685.
You have already liked this post today
*The market analysis posted here is meant to increase your awareness, but not to give instructions to make a trade.
Notre plan de trading pour les prochaines heures est de vendre l'euro en dessous du sommet du canal de tendance baissière, avec des objectifs à 1.1189, et de combler
Liens utiles : Mes autres articles sont disponibles dans cette section Cours pour débutants d'InstaForex Analytique Populaire Ouvrir un compte de trading Important : Les débutants en trading forex doivent
Sur le graphique en 4 heures, l'indicateur Stochastic Oscillator semble croiser en ACHAT, associé au mouvement des prix au-dessus de la WMA (21) et à l'apparition d'un modèle Bullish
Bien que les vendeurs dominent toujours le graphique de l'EUR/JPY sur 4 heures, cela est confirmé par le mouvement des prix qui évolue en dessous de la WMA (21) présentant
Your IP address shows that you are currently located in the USA. If you are a resident of the United States, you are prohibited from using the services of InstaFintech Group including online trading, online transfers, deposit/withdrawal of funds, etc.
If you think you are seeing this message by mistake and your location is not the US, kindly proceed to the website. Otherwise, you must leave the website in order to comply with government restrictions.
Why does your IP address show your location as the USA?
Please confirm whether you are a US resident or not by clicking the relevant button below. If you choose the wrong option, being a US resident, you will not be able to open an account with InstaTrade anyway.
We are sorry for any inconvenience caused by this message.

