Voir aussi


 28.03.2023 12:48 AM
Overview :
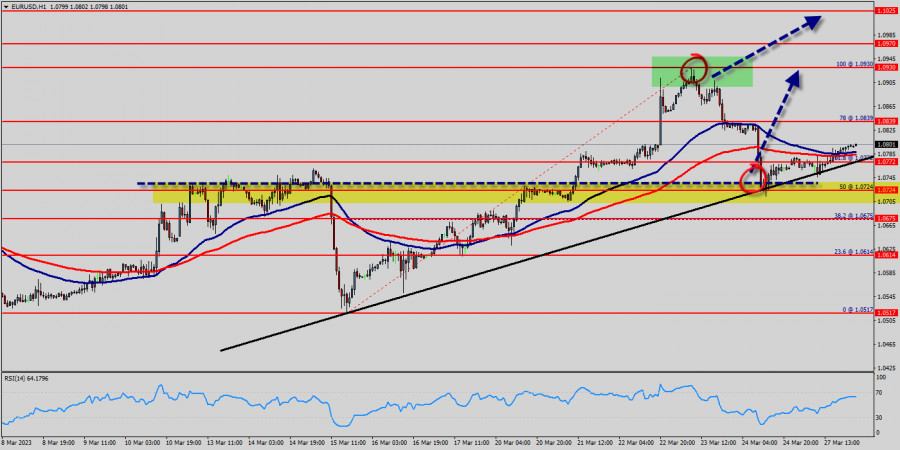
Euro parity still in play ahead of decisive US inflation data, for that common currency came within whisker of 1.0830 this week. Right now, the EUR/USD pair is still moving around the price of 1.0703 - 1.0839. The currency pair EUR/USD is trading above the support levels of 1.0661, 1.0703 and 1.0761. The euro to US dollar (EUR/USD) rate has fallen about 1.75% year-to-date to trade around 1.0839.
The raise is comparable to gains last seen for two weeks, when the European Central Bank unleashed its massive stimulus programme. The EUR/USD pair continues to move upwards from the level of 1.0761, which represents the double bottom in the hourly chart. The pair rose from the level of 1.0703 to the top around 1.0839. Today, the first resistance level is seen at 1.0839 followed by 1.0895, while daily support is seen at the levels of 1.0761 and 1.0703.
According to the previous events, the EUR/USD pair is still trading between the levels of 1.0761 and 1.0895. Hence, we expect a range of 134 pips in coming hours (1.0895 - 1.0761). The first resistance stands at the price of 1.0761, therefore if the EUR/USD pair succeed to break through the resistance level of 1.0761, the market will rise further to 1.0895. This would suggest a bullish market because the RSI indicator is still in a positive area and does not show any trend-reversal signs. The pair is expected to climb higher towards at least 1.0947 in order to test the second resistance (1.0947).
The US Dollar and the Euro are two of the most prominent and well-known currencies in the world. The Euro versus US Dollar (EUR/USD) currency pair has the largest global trading volume, meaning it is the world's most-traded currency pair.
Whether you find the instrument easy or difficult to trade on, it's not a pair that many traders neglect, due to its daily volatility and price movement. The market is indicating a bullish opportunity above the above-mentioned support levels, for that the bullish outlook remains the same as long as the 100 EMA is headed to the upside. Today, resistance is seen at the levels of 1.0839, 1.0895 and 1.0947.
So, we expect the price to set above the strong support at the levels of 1.0761 and 1.0703; because the price is in a bullish channel now. The RSI starts signaling an upward trend. Consequently, the market is likely to show signs of a bullish trend.
Thus, it will be good to buy above the level of 1.0761 with the first target at 1.0839 and further to 1.0895 in order to test the daily resistance. If the GBP/USD pair is able to break out the daily resistance at 1.0895 , the market will rise further to 1.0947 to approach resistance 3 in coming hours or days.
However, the price spot of 1.0703 remains a significant support zone. Therefore, the trend is still bullish as long as the level of 1.0703 is not breached.
You have already liked this post today
*The market analysis posted here is meant to increase your awareness, but not to give instructions to make a trade.
Liens utiles : Mes autres articles sont disponibles dans cette section Cours InstaForex pour débutants Analyses Populaires Ouvrir un compte de trading Important : Les débutants en trading forex doivent
Si nous examinons le graphique en 4 heures, la paire de devises croisées GBP/JPY évolue dans un biais haussier, ce qui est confirmé par son mouvement de prix qui progresse
Sur le graphique de 4 heures, l'instrument de la marchandise Or semble présenter une divergence entre le mouvement du prix de l'Or et l'indicateur Stochastic Oscillator, ce qui indique
Your IP address shows that you are currently located in the USA. If you are a resident of the United States, you are prohibited from using the services of InstaFintech Group including online trading, online transfers, deposit/withdrawal of funds, etc.
If you think you are seeing this message by mistake and your location is not the US, kindly proceed to the website. Otherwise, you must leave the website in order to comply with government restrictions.
Why does your IP address show your location as the USA?
Please confirm whether you are a US resident or not by clicking the relevant button below. If you choose the wrong option, being a US resident, you will not be able to open an account with InstaTrade anyway.
We are sorry for any inconvenience caused by this message.

