Voir aussi


 20.04.2023 02:02 AM
Overview :
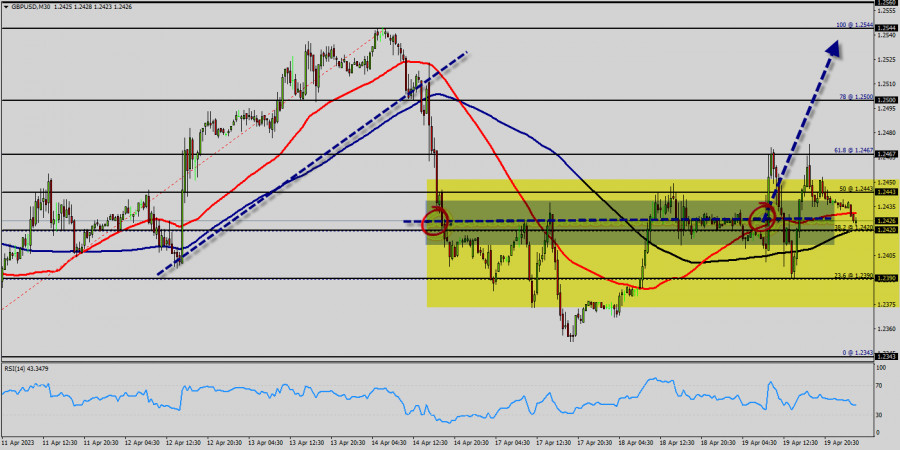
The GBP/USD pair continues to move upwards from the level of 1.2390. According to the previous events, the GBP/USD pair is still moving between the levels of 1.2390 and 1.2427; for that we expect a range of 110 pips (1.2500 - 1.2390). On the one-hour chart, immediate support level is seen at 1.2390, which coincides with a ratio of 23.6% Fibonacci retracement.
Currently, the price is moving in a bullish channel. This is confirmed by the RSI indicator signaling that we are still in a bullish trending market. The price is still above the moving average (100) and (50). Therefore, if the trend is able to break out through the first resistance level of 1.2443, we would see the pair climbing towards the daily resistance at 1.2500 to test it. It would also be wise to consider where to place stop loss; this should be set below the second support of 1.2343.
It should always be noted that: If the trend is upward, the strength of the currency will be defined as follows: GBPis in an uptrend and USD is in a downtrend. The stop loss should never exceed your maximum exposure amounts. The market is highly volatile if the last day had huge volatility.
Signal :
According to the previous events, the price of the GBP/USD pair has been still trading between the levels of 1.2343 and 1.2500. The level of 1.2544 is representing the double top and the weekly support one has set at the same price. Buy above the spot of 1.2420 with the targets 1.2427 and 1.2544. On the other hand, the daily strong support is seen at 1.2390. If the GB/USD pair is able to break out the level of 1.2390, the market will decline further to 1.2303.
You have already liked this post today
*The market analysis posted here is meant to increase your awareness, but not to give instructions to make a trade.
Liens utiles : Mes autres articles sont disponibles dans cette section Cours InstaForex pour débutants Analytique Populaire Ouvrir un compte de trading Important : Les débutants en trading forex doivent
Avec l'apparition du motif Bullish 123 au milieu des conditions d'affaiblissement de cette paire de devises exotiques, qui a été confirmée par le mouvement du prix USD/IDR évoluant dans
Sur le graphique 4 heures de l'instrument de la matière première du pétrole brut, une divergence apparaît entre le mouvement du prix de #CL et l'indicateur Stochastic Oscillator. Cela indique
Dans le scénario opposé, si l'euro tombe en dessous de 1.1490, il est probable qu'il atteindra la moyenne mobile exponentielle (EMA) de 200, située à 1.1340 et qui coïncide avec
Club InstaForex

Your IP address shows that you are currently located in the USA. If you are a resident of the United States, you are prohibited from using the services of InstaFintech Group including online trading, online transfers, deposit/withdrawal of funds, etc.
If you think you are seeing this message by mistake and your location is not the US, kindly proceed to the website. Otherwise, you must leave the website in order to comply with government restrictions.
Why does your IP address show your location as the USA?
Please confirm whether you are a US resident or not by clicking the relevant button below. If you choose the wrong option, being a US resident, you will not be able to open an account with InstaTrade anyway.
We are sorry for any inconvenience caused by this message.

