Actual patterns

Patterns are graphical models which are formed in the chart by the price. According to one of the technical analysis postulates, history (price movement) repeats itself. It means that the price movements are often similar in the same situations which makes it possible to predict the further development of the situation with a high probability.
Relevant patterns by InstaTrade is an easy-to-use service which allows you to be aware of latest changes in the market and react to clues from the market in time. In our service you will always find the latest and most relevant patterns on any pair and any timeframe.
Double Bottom
was formed on 28.03 at 22:15:04 (UTC+0)
signal strength 2 of 5
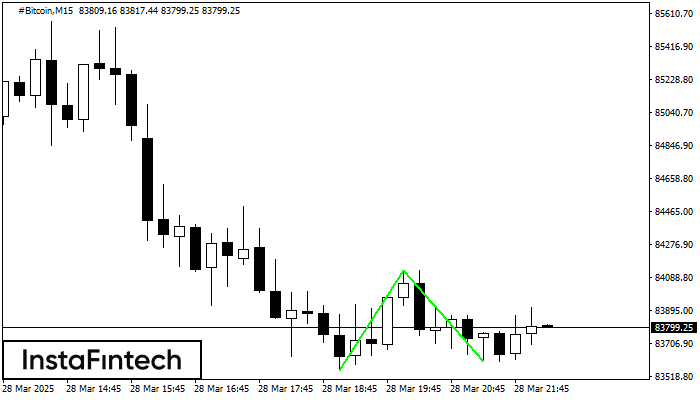
The Double Bottom pattern has been formed on #Bitcoin M15. Characteristics: the support level 83552.05; the resistance level 84127.84; the width of the pattern 57579 points. If the resistance level is broken, a change in the trend can be predicted with the first target point lying at the distance of 52661 points.
The M5 and M15 time frames may have more false entry points.
See Also
- All
- All
- Bearish Rectangle
- Bearish Symmetrical Triangle
- Bearish Symmetrical Triangle
- Bullish Rectangle
- Double Top
- Double Top
- Triple Bottom
- Triple Bottom
- Triple Top
- Triple Top
- All
- All
- Buy
- Sale
- All
- 1
- 2
- 3
- 4
- 5
Triple Bottom
was formed on 01.05 at 17:39:48 (UTC+0)
signal strength 1 of 5

The Triple Bottom pattern has been formed on #KO M5. It has the following characteristics: resistance level 71.64/71.57; support level 71.39/71.35; the width is 25 points. In the event
The M5 and M15 time frames may have more false entry points.
Open chart in a new window
Inverse Head and Shoulder
was formed on 01.05 at 17:30:04 (UTC+0)
signal strength 1 of 5

According to M5, NZDCAD is shaping the technical pattern – the Inverse Head and Shoulder. In case the Neckline 0.8179/0.8176 is broken out, the instrument is likely to move toward
The M5 and M15 time frames may have more false entry points.
Open chart in a new window
Bullish pennant
was formed on 01.05 at 16:40:46 (UTC+0)
signal strength 1 of 5
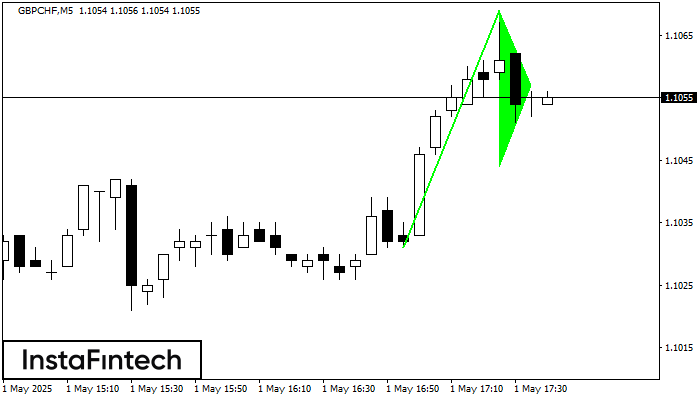
The Bullish pennant signal – Trading instrument GBPCHF M5, continuation pattern. Forecast: it is possible to set up a buy position above the pattern’s high of 1.1069, with the prospect
The M5 and M15 time frames may have more false entry points.
Open chart in a new window