Lihat juga


 21.03.2023 03:41 PM
XAU/USD retreats from its annual high reached on March 20 at 2,009.66. The global banking jitters have passed for now and US Treasury yields have been bouncing, erasing Gold's strength.
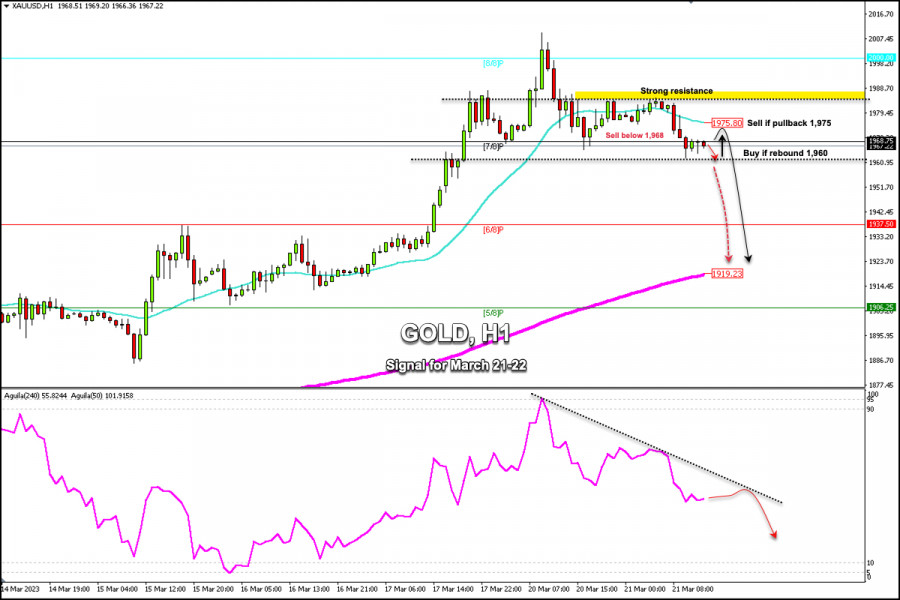
According to the 1-hour chart, gold is trading below the 21 SMA located at 1,975 and below the strong resistance of 1,986. We can clearly see that the asset is under strong bearish pressure but it could find a bottom around 1,960. At this level in the 4-hour chart, we can see the 21 SMA which will act as strong support and gold could then resume the bullish cycle.
In case gold breaks out sharply and consolidates below 1,960, we would expect a bearish acceleration and the instrument could reach the 6/8 Murray at 1,937 and could ultimately reach the 200 EMA located at 1,919.
On the contrary, if gold remains above 1,960, it could give us a signal to buy with targets at 1,975 (21 SMA) and 1,986 (weekly_resistance).
Since its high reached in the last hours, gold has made a correction of almost $40 as part of profit taking. The instrument is likely to see a technical rebound in the coming hours and then continue with a short-term downtrend.
Our trading plan for the next few hours is to sell below 7/8 Murray located at 1,968, with targets at 1,960. Around this level, we can expect a technical bounce to buy with targets at 1,975. The Eagle indicator from 20 March is giving a negative signal. Hence, as long as the metal trades below 1,985, any technical bounce will be seen as a signal to sell.
You have already liked this post today
*Analisis pasar yang diposting disini dimaksudkan untuk meningkatkan pengetahuan Anda namun tidak untuk memberi instruksi trading.
Pada sesi Amerika awal, pasangan EUR/USD trading di sekitar 1.1178, di bawah 200 EMA, dan di bawah 21 SMA dengan tekanan bearish. Setelah mencapai area 1.1270, euro gagal menembus saluran
Pada awal sesi Amerika, emas trading sekitar 3,174.33, mundur setelah mencapai puncak saluran tren menurun. Kemarin, emas jatuh ke level terendah 3,120 dan pulih lebih dari $130 dalam waktu kurang
Pada hari Kamis, pasangan EUR/USD dua kali turun menuju level Fibonacci 127,2% di 1,1181 dan memantul kembali kedua kalinya, menandakan reversal yang menguntungkan euro. Ini membuka peluang untuk kelanjutan pertumbuhan
Jumat mungkin menandai hari keempat berturut-turut dari candle harian bearish (hitam). Terakhir kali pola ini terjadi adalah dari 3–6 Februari. Dalam kejadian tersebut—dan dua kejadian sebelumnya—koreksi minimal 1–2 hari mengikuti
Your IP address shows that you are currently located in the USA. If you are a resident of the United States, you are prohibited from using the services of InstaFintech Group including online trading, online transfers, deposit/withdrawal of funds, etc.
If you think you are seeing this message by mistake and your location is not the US, kindly proceed to the website. Otherwise, you must leave the website in order to comply with government restrictions.
Why does your IP address show your location as the USA?
Please confirm whether you are a US resident or not by clicking the relevant button below. If you choose the wrong option, being a US resident, you will not be able to open an account with InstaTrade anyway.
We are sorry for any inconvenience caused by this message.

