Lihat juga


 18.10.2022 03:38 PM
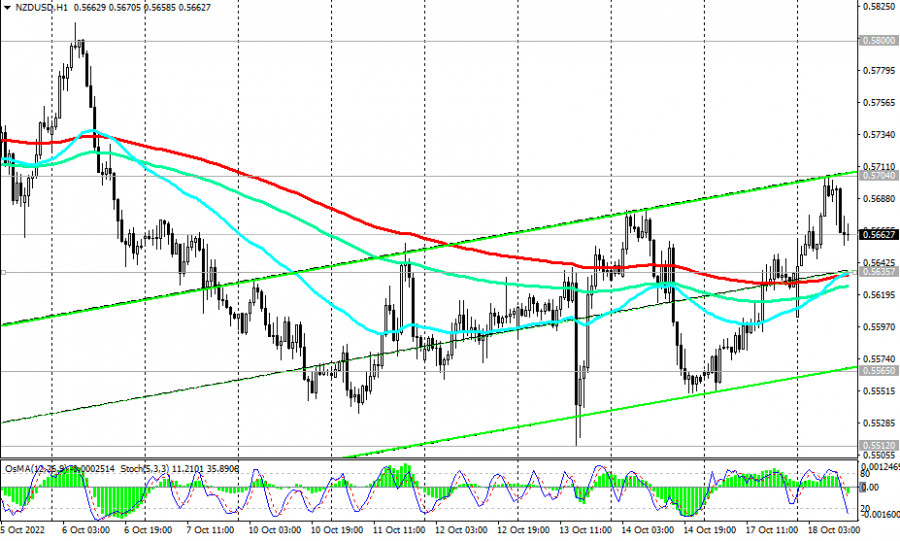
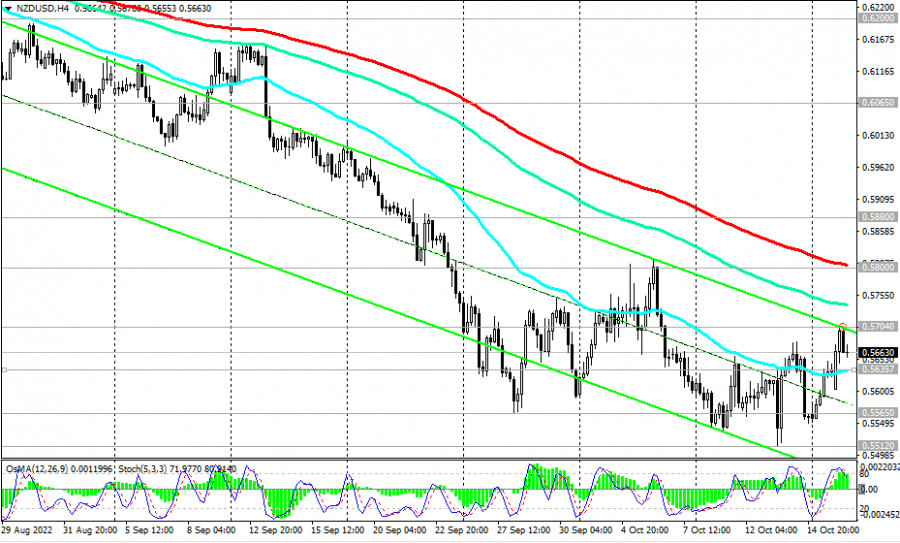
Today, NZD/USD half retains the bullish momentum gained from the inflation data in New Zealand that exceeded the forecast, while also trying to stay in the zone above the short-term important support level of 0.5635 (200 EMA on the 1-hour chart). As of writing, the pair is trading near the 0.5662 mark. It is characteristic that the OsMA and Stochastic technical indicators paint a contradictory picture: on the daily and weekly charts they turn to long positions, and on the 1-hour and 4-hour charts they turn to short positions, signaling the end of the upward correction.
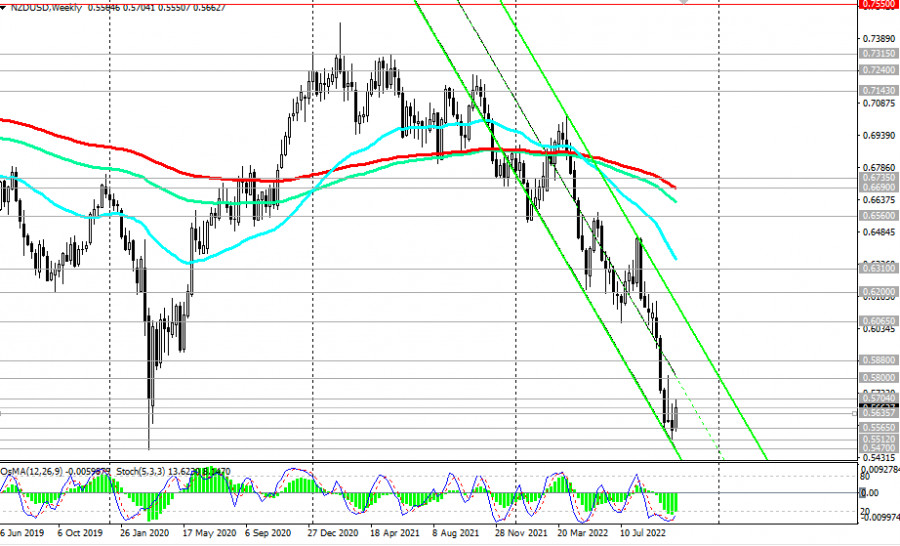
The signal for the resumption of sales will be a breakdown of the support level of 0.5635. In this case, NZD/USD will head deeper into the descending channel on the weekly chart and towards 0.5470.
In an alternative scenario, the upward correction will continue to the resistance levels of 0.5800 (200 EMA on the 4-hour chart), 0.5880 (50 EMA on the daily chart).
In general, the downward dynamics of NZD/USD prevails, while the pair remains in the zone of a long-term bear market—below the key resistance levels of 0.6690 (200 EMA on the weekly chart), 0.6310 (200 EMA on the daily chart). Only their breakdown will bring the pair back into the zone of a long-term bull market.
And today, the volatility in the NZD/USD pair may increase again (in the period after 13:15 - 14:00 GMT), which will be associated with the publication of macro statistics for the US and New Zealand, as well as at 21:30 during the speech of Fed representative Neel Kashkari.
Support levels: 0.5635, 0.5600, 0.5565, 0.5512, 0.5470
Resistance levels: 0.5704, 0.5800, 0.5880, 0.6065, 0.6200, 0.6310, 0.6560, 0.6690, 0.6735
Trading Tips
Sell Stop 0.5620. Stop-Loss 0.5710. Take-Profit 0.5600, 0.5565, 0.5512, 0.5470
Buy Stop 0.5710. Stop-Loss 0.56250. Take-Profit 0.5800, 0.5880, 0.6065, 0.6200, 0.6310, 0.6560, 0.6690, 0.6735
You have already liked this post today
*Analisis pasar yang diposting disini dimaksudkan untuk meningkatkan pengetahuan Anda namun tidak untuk memberi instruksi trading.
Tidak ada acara makroekonomi yang dijadwalkan untuk hari Jumat. Perkembangan fundamental juga akan terbatas, tetapi sama sekali tidak jelas faktor mana yang memengaruhi pembentukan harga. Pound dan euro memiliki alasan
Pada hari Kamis, pasangan GBP/USD melanjutkan penurunan berombaknya dalam saluran menyamping dan gagal untuk menembus keluar, berbeda dengan pasangan EUR/USD. Dari sudut pandang kami, pound Inggris memiliki dua kali lebih
Pada hari Kamis, pasangan mata uang EUR/USD tiba-tiba keluar dari channel datar tempatnya telah diperdagangkan selama tiga minggu. Ini terjadi selama sesi perdagangan AS, meskipun tidak ada rilis data makroekonomi
Pada hari Kamis, pasangan mata uang EUR/USD menunjukkan tren yang sangat menarik. Sebagai pengingat, hasil pertemuan FOMC diumumkan pada Rabu malam, dan sekali lagi kami menganggapnya hawkish. Penting untuk diingat
Pada hari Kamis, pasangan mata uang GBP/USD terus trading dalam saluran menyamping, yang terlihat dalam kerangka waktu per jam. Dua pertemuan bank sentral — yang masing-masing dapat dianggap menguntungkan bagi
Dalam prediksi pagi saya, saya fokus pada level 1.3286 dan merencanakan entri pasar berdasarkan level tersebut. Mari kita lihat grafik 5-menit dan analisis apa yang terjadi. Terjadi penembusan dan pengujian
Dalam ramalan pagi saya, saya fokus pada level 1.1269 dan merencanakan untuk membuat keputusan masuk pasar dari level tersebut. Mari kita lihat grafik 5-menit dan analisis apa yang terjadi. Penurunan
Pada hari Rabu, pasangan GBP/USD tidak menunjukkan pergerakan yang signifikan. Setelah Jerome Powell menyatakan perlunya waktu lebih untuk menilai dampak ekonomi penuh dari tarif Trump, dolar AS menguat seperti yang
Pada hari Rabu, pasangan mata uang EUR/USD terus diperdagangkan dalam chanel datar, yang terlihat pada timeframe per jam. Seperti yang telah kami peringatkan, pertemuan Federal Reserve tidak mengubah apapun. Meskipun
Pada hari Rabu, pasangan mata uang GBP/USD terus diperdagangkan dalam channel datar, yang terlihat jelas pada timeframe per jam. Hampir tidak ada pergerakan sepanjang hari, dan tidak ada peristiwa fundamental
Indikator pola
grafis.
Lihat hal-hal
yang belum pernah anda lihat!
Klub InstaTrade

Your IP address shows that you are currently located in the USA. If you are a resident of the United States, you are prohibited from using the services of InstaFintech Group including online trading, online transfers, deposit/withdrawal of funds, etc.
If you think you are seeing this message by mistake and your location is not the US, kindly proceed to the website. Otherwise, you must leave the website in order to comply with government restrictions.
Why does your IP address show your location as the USA?
Please confirm whether you are a US resident or not by clicking the relevant button below. If you choose the wrong option, being a US resident, you will not be able to open an account with InstaTrade anyway.
We are sorry for any inconvenience caused by this message.


