Lihat juga


 28.03.2025 11:48 AM
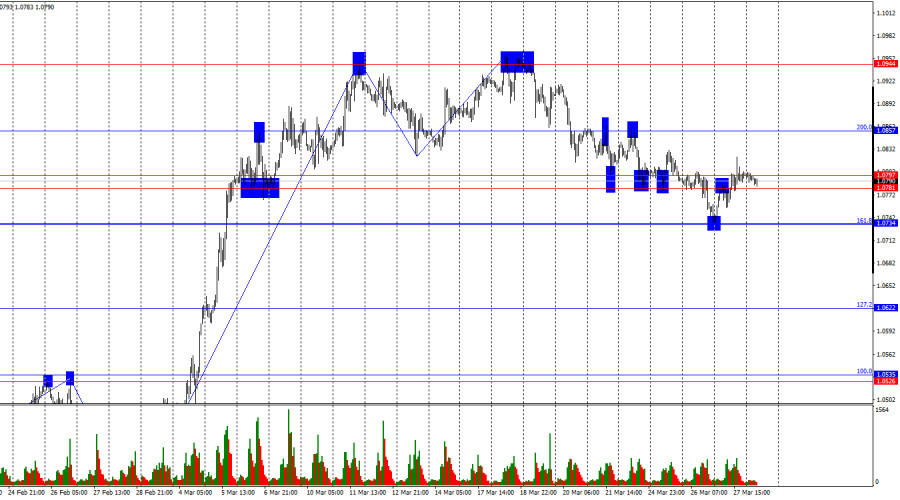
The wave structure on the hourly chart has changed. The last completed upward wave broke the previous peak by just a few points, while the last downward wave broke the previous low. This suggests a gradual trend reversal in a bearish direction. Donald Trump's tariffs have put strong pressure on the dollar over the past few weeks, but the market has reacted rather weakly to the latest round of tariffs.
Thursday's news background was important, but not in the way traders had hoped. Overnight, it was announced that Donald Trump had imposed 25% tariffs on all imported cars, rendering the rest of the day's events irrelevant for market participants. The dollar remained under pressure all day, even despite stronger-than-expected U.S. GDP data. Countries affected by the new tariffs, especially the European Union, are likely preparing a response. We are clearly in the midst of a trade war. However, traders are no longer rushing to sell the dollar. While the dollar fell all day yesterday, the decline was not particularly strong. The market is gradually coming to terms with the new reality, which implies that more rounds of tariffs from the U.S. are likely. If the dollar falls with each new round, it could soon drop to around 1.20. Still, the dollar's value should be influenced by more than just Trump—and the market understands that. As mentioned, the U.S. GDP report beat expectations.
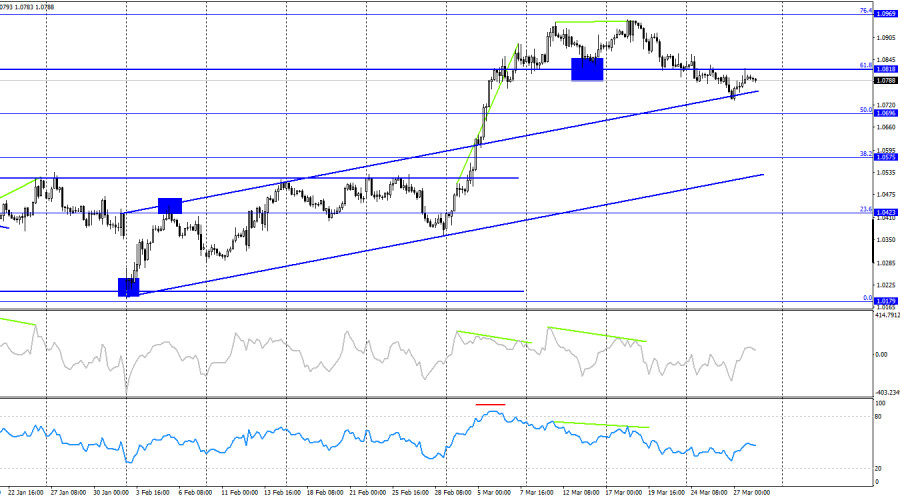
On the 4-hour chart, the pair reversed in favor of the U.S. dollar following the formation of another bearish divergence and a consolidation below the 61.8% Fibonacci level at 1.0818. This suggests continued decline toward the next retracement level at 50.0% – 1.0696. The euro still has room to fall, as the price remains above the upward trend channel. No emerging divergences are currently observed on any indicator.
Commitments of Traders (COT) Report:
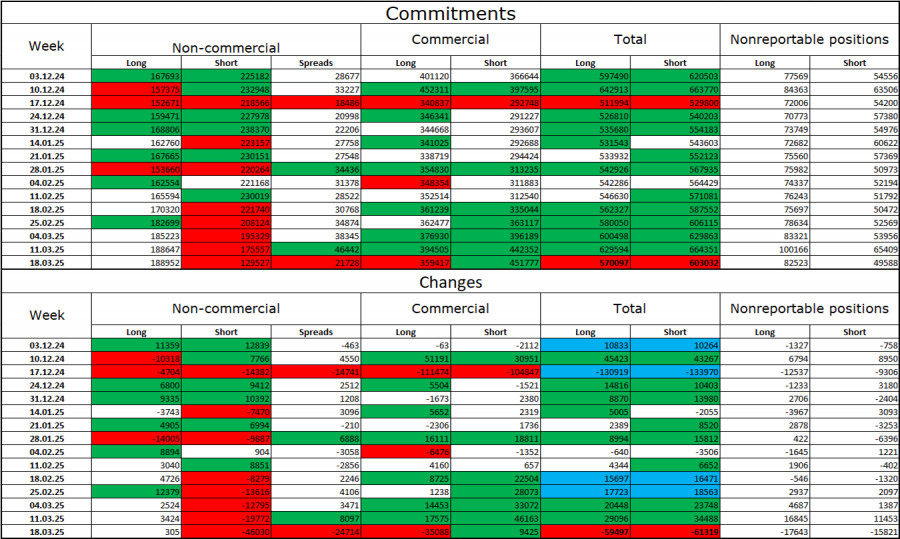
During the most recent reporting week, professional traders opened 305 long positions and closed 46,030 short positions. The "Non-commercial" group's sentiment has once again turned bullish—thanks to Donald Trump. The total number of long positions held by speculators now stands at 189,000, while short positions have dropped to 129,000.
For twenty consecutive weeks, large players were shedding euro positions, but they've now been reducing short positions and increasing long ones for six straight weeks. The diverging paths in monetary policy between the ECB and the Fed still favor the U.S. dollar due to the widening interest rate differential. However, Trump's policy is a stronger factor for traders, as it could have a dovish effect on the FOMC and even lead to a recession in the U.S. economy.
Economic Calendar for the U.S. and the Eurozone:
On March 28, the economic calendar includes four events, none of which are considered highly important. As a result, the impact of news flow on market sentiment on Friday may be limited.
EUR/USD Forecast and Trading Tips:
Selling the pair was possible after a close below the 1.0781–1.0797 zone, targeting 1.0734 and 1.0622. The first target has been reached. Today, short positions can be considered on a bounce from the 1.0781–1.0797 zone with the same targets. Long positions may be considered on an hourly close above this zone, targeting 1.0857, but for now, bears remain in control.
Fibonacci levels are plotted from 1.0529 to 1.0213 on the hourly chart and from 1.1214 to 1.0179 on the 4-hour chart.
You have already liked this post today
*Analisis pasar yang diposting disini dimaksudkan untuk meningkatkan pengetahuan Anda namun tidak untuk memberi instruksi trading.
Penurunan suku bunga oleh Reserve Bank of Australia kemarin dari 4,10% menjadi 3,85%, meskipun sudah diperkirakan secara luas, tidak memungkinkan dolar Australia untuk mengkonsolidasikan di atas level resistensi 0,6444. Namun
Meski di chart 4 jamnya pasangan mata uang silang AUD/JPY tengah melemah, namun nampaknya pelemahan ini hanya bersifat koreksi sesaat selama tidak sampai tembus dan menutup dibawah level 91,47 maka
Pasangan USD/CAD turun secara bertahap selama lima hari berturut-turut, tetap berada di bawah garis indikator keseimbangan harian. Pergerakan di bawah level support 1,3898 akan mempercepat penurunan menuju support pertama
Pada chart 4 jamnya, instrumen komoditi Perak nampak terlihat kemunculan Konvergen antara pergerakan harga instrument komoditi Perak dengan indikator Stochastic Oscillator, sehingga dalam waktu dekat ini Perak berpotensi untuk menguat
Jika harga turun di bawah 3.281, instrumen ini diprediksi akan menutup celah di 3.201, atau sebaliknya, konsolidasi di atas 3.290 diharapkan akan menutup celah yang ditinggalkannya sekitar 3.325 pada
Euro telah meninggalkan celah di sekitar 1,1170. Jika EUR/USD jatuh di bawah level 6/8 Murray yang terletak di 1,1230, tekanan bearish dapat meningkat, dengan harga berpotensi menutupi celah
Akun PAMM
InstaTrade

Your IP address shows that you are currently located in the USA. If you are a resident of the United States, you are prohibited from using the services of InstaFintech Group including online trading, online transfers, deposit/withdrawal of funds, etc.
If you think you are seeing this message by mistake and your location is not the US, kindly proceed to the website. Otherwise, you must leave the website in order to comply with government restrictions.
Why does your IP address show your location as the USA?
Please confirm whether you are a US resident or not by clicking the relevant button below. If you choose the wrong option, being a US resident, you will not be able to open an account with InstaTrade anyway.
We are sorry for any inconvenience caused by this message.


