Pola sebenarnya

Bullish Rectangle
was formed on 26.03 at 07:36:48 (UTC+0)
signal strength 1 of 5
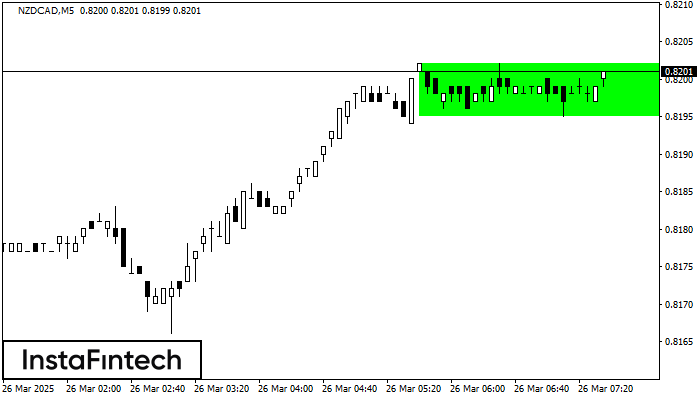
According to the chart of M5, NZDCAD formed the Bullish Rectangle. This type of a pattern indicates a trend continuation. It consists of two levels: resistance 0.8202 and support 0.8195. In case the resistance level 0.8202 - 0.8202 is broken, the instrument is likely to follow the bullish trend.
The M5 and M15 time frames may have more false entry points.
Lihat juga
- All
- All
- Bearish Rectangle
- Bearish Symmetrical Triangle
- Bearish Symmetrical Triangle
- Bullish Rectangle
- Double Top
- Double Top
- Triple Bottom
- Triple Bottom
- Triple Top
- Triple Top
- All
- All
- Buy
- Sale
- All
- 1
- 2
- 3
- 4
- 5
Persegi Bullish
was formed on 01.05 at 04:51:26 (UTC+0)
signal strength 1 of 5
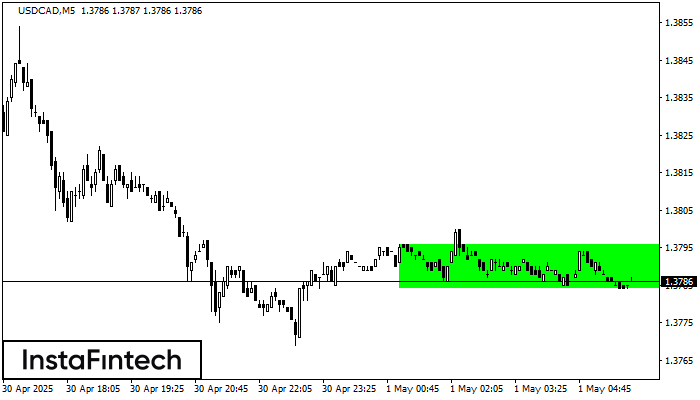
Menurut grafik dari M5, USDCAD terbentuk Persegi Bullish yang merupakan pola dari kelanjutan tren. Pola terkandung dalam batas berikut: batas yang lebih rendah 1.3784 – 1.3784 dan batas atas 1.3796
Rangka waktu M5 dan M15 mungkin memiliki lebih dari titik entri yang keliru.
Open chart in a new window
Persegi Bearish
was formed on 01.05 at 04:45:28 (UTC+0)
signal strength 1 of 5
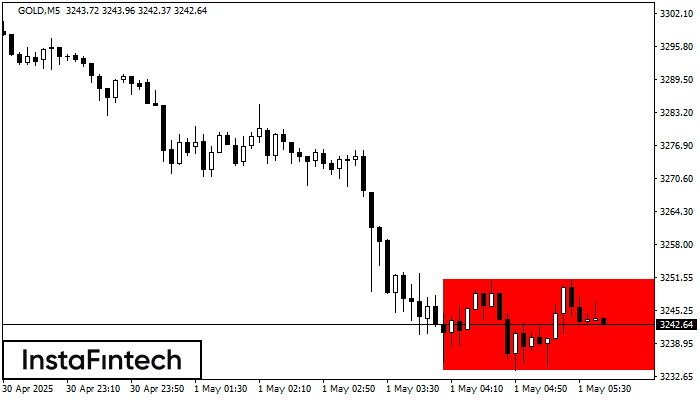
Menurut grafik dari M5, GOLD terbentuk Persegi Bearish. Pola menunjukkan kelanjutan tren. Batas atas adalah 3251.29, batas rendah adalah 3233.91. Sinyal berarti posisi jual harus dibuka setelah menetapkan harga dibawah
Rangka waktu M5 dan M15 mungkin memiliki lebih dari titik entri yang keliru.
Open chart in a new window
Teratas Ganda
was formed on 01.05 at 04:00:53 (UTC+0)
signal strength 3 of 5
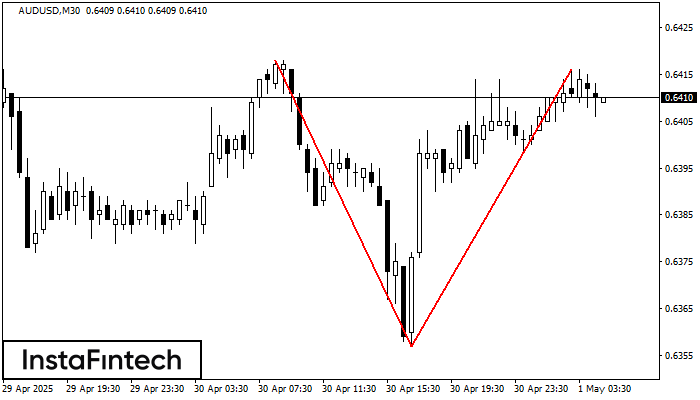
Pola reversal Teratas Ganda telah terbentuk pada AUDUSD M30. Karakteristik: batas atas 0.6418; batas bawah 0.6357; lebar pola 59 poin. Transaksi jual lebih baik dibuka di bawah batas bawah 0.6357
Open chart in a new window