Pola sebenarnya

Triple Bottom
was formed on 26.03 at 08:15:30 (UTC+0)
signal strength 2 of 5
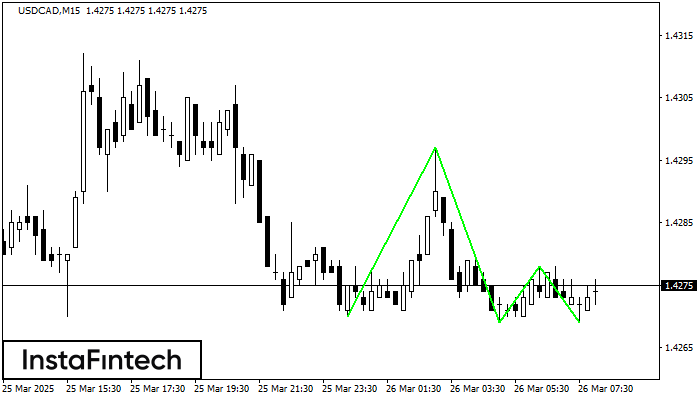
The Triple Bottom pattern has formed on the chart of the USDCAD M15 trading instrument. The pattern signals a change in the trend from downwards to upwards in the case of breakdown of 1.4297/1.4278.
The M5 and M15 time frames may have more false entry points.
Lihat juga
- All
- All
- Bearish Rectangle
- Bearish Symmetrical Triangle
- Bearish Symmetrical Triangle
- Bullish Rectangle
- Double Top
- Double Top
- Triple Bottom
- Triple Bottom
- Triple Top
- Triple Top
- All
- All
- Buy
- Sale
- All
- 1
- 2
- 3
- 4
- 5
Double Bottom
сформирован 01.05 в 04:56:29 (UTC+0)
сила сигнала 1 из 5
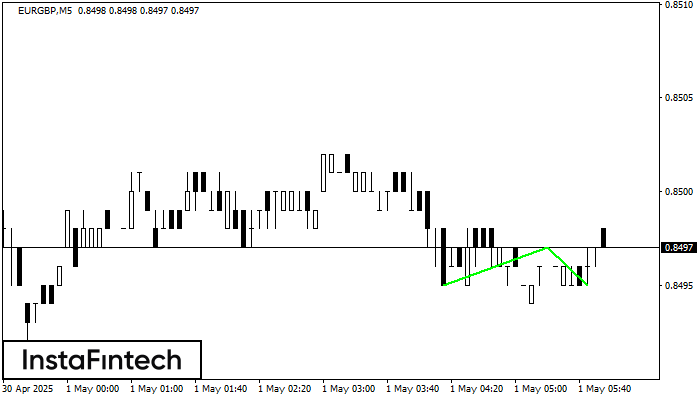
The Double Bottom pattern has been formed on EURGBP M5. This formation signals a reversal of the trend from downwards to upwards. The signal is that a buy trade should
The M5 and M15 time frames may have more false entry points.
Открыть график инструмента в новом окне
Bullish Rectangle
сформирован 01.05 в 04:51:26 (UTC+0)
сила сигнала 1 из 5
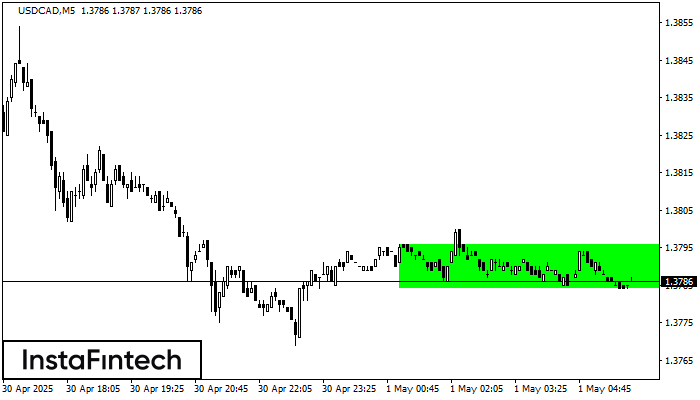
According to the chart of M5, USDCAD formed the Bullish Rectangle which is a pattern of a trend continuation. The pattern is contained within the following borders: the lower border
The M5 and M15 time frames may have more false entry points.
Открыть график инструмента в новом окне
Bearish Rectangle
сформирован 01.05 в 04:45:28 (UTC+0)
сила сигнала 1 из 5
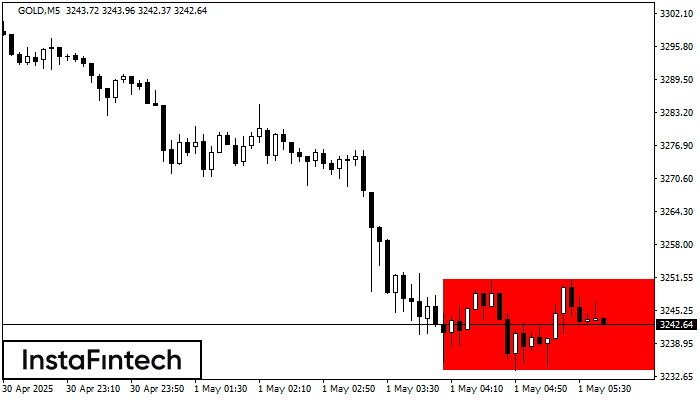
According to the chart of M5, GOLD formed the Bearish Rectangle. The pattern indicates a trend continuation. The upper border is 3251.29, the lower border is 3233.91. The signal means
The M5 and M15 time frames may have more false entry points.
Открыть график инструмента в новом окне