Pola sebenarnya

Bearish Rectangle
was formed on 04.04 at 21:58:39 (UTC+0)
signal strength 1 of 5

According to the chart of M5, EURUSD formed the Bearish Rectangle which is a pattern of a trend continuation. The pattern is contained within the following borders: lower border 1.0924 – 1.0924 and upper border 1.0967 – 1.0967. In case the lower border is broken, the instrument is likely to follow the downward trend.
The M5 and M15 time frames may have more false entry points.
Lihat juga
- All
- All
- Bearish Rectangle
- Bearish Symmetrical Triangle
- Bearish Symmetrical Triangle
- Bullish Rectangle
- Double Top
- Double Top
- Triple Bottom
- Triple Bottom
- Triple Top
- Triple Top
- All
- All
- Buy
- Sale
- All
- 1
- 2
- 3
- 4
- 5
Triple Top
was formed on 14.04 at 22:15:55 (UTC+0)
signal strength 2 of 5
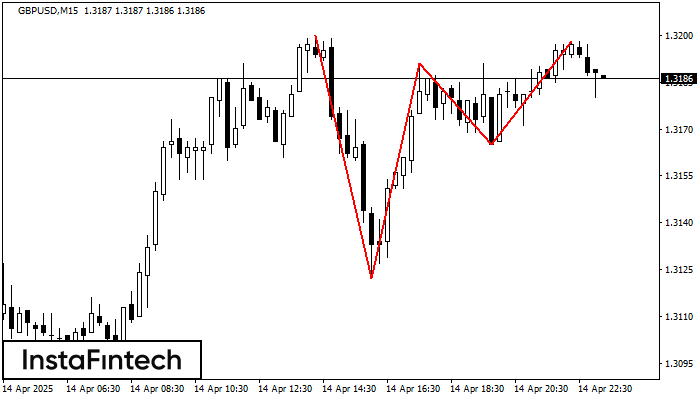
On the chart of the GBPUSD M15 trading instrument, the Triple Top pattern that signals a trend change has formed. It is possible that after formation of the third peak
The M5 and M15 time frames may have more false entry points.
Open chart in a new window
Double Bottom
was formed on 14.04 at 22:00:04 (UTC+0)
signal strength 3 of 5
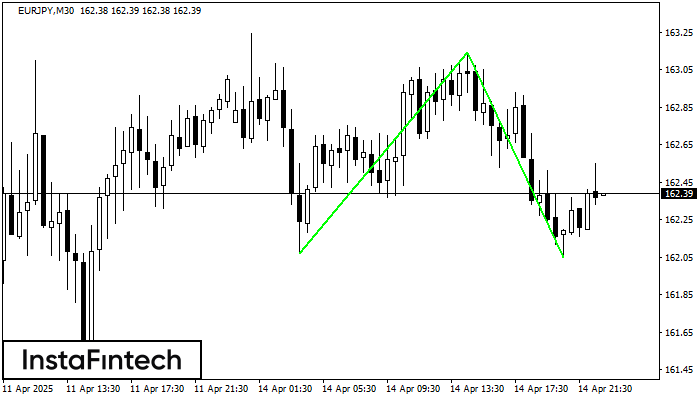
The Double Bottom pattern has been formed on EURJPY M30; the upper boundary is 163.14; the lower boundary is 162.05. The width of the pattern is 107 points. In case
Open chart in a new window
Double Bottom
was formed on 14.04 at 22:00:04 (UTC+0)
signal strength 1 of 5
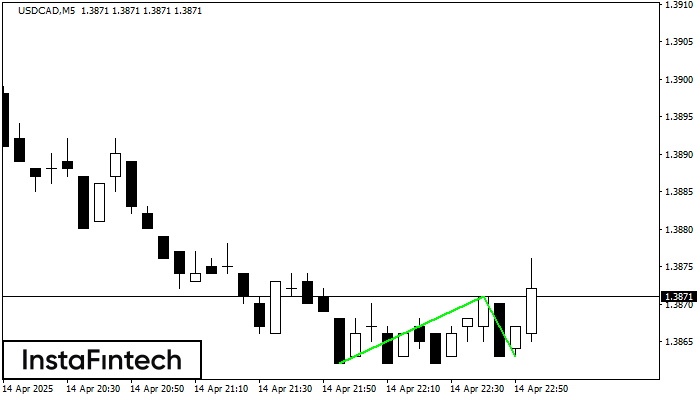
The Double Bottom pattern has been formed on USDCAD M5. Characteristics: the support level 1.3862; the resistance level 1.3871; the width of the pattern 9 points. If the resistance level
The M5 and M15 time frames may have more false entry points.
Open chart in a new window