Pola sebenarnya

Double Bottom
was formed on 14.04 at 22:00:04 (UTC+0)
signal strength 1 of 5
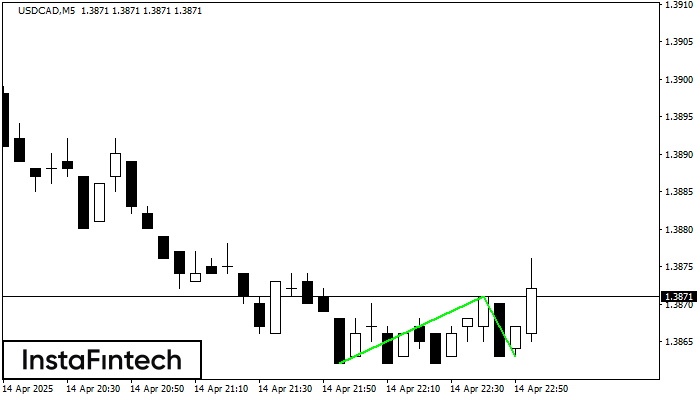
The Double Bottom pattern has been formed on USDCAD M5. Characteristics: the support level 1.3862; the resistance level 1.3871; the width of the pattern 9 points. If the resistance level is broken, a change in the trend can be predicted with the first target point lying at the distance of 8 points.
The M5 and M15 time frames may have more false entry points.
Lihat juga
- All
- All
- Bearish Rectangle
- Bearish Symmetrical Triangle
- Bearish Symmetrical Triangle
- Bullish Rectangle
- Double Top
- Double Top
- Triple Bottom
- Triple Bottom
- Triple Top
- Triple Top
- All
- All
- Buy
- Sale
- All
- 1
- 2
- 3
- 4
- 5
Kepala dan bahu
was formed on 01.05 at 11:05:37 (UTC+0)
signal strength 1 of 5
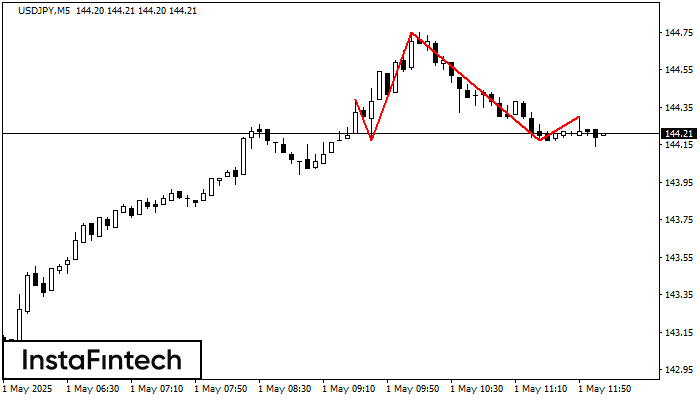
Menurut grafik M5, USDJPY membentuk pola Kepala dan bahu. Puncak The Head ditetapkan di 144.75 sementara garis median the Neck ditemukan di 144.17/144.17. Formasi pola Kepala dan bahu terbukti mensinyalkan
Rangka waktu M5 dan M15 mungkin memiliki lebih dari titik entri yang keliru.
Open chart in a new window
Bawah Ganda
was formed on 01.05 at 11:00:18 (UTC+0)
signal strength 1 of 5
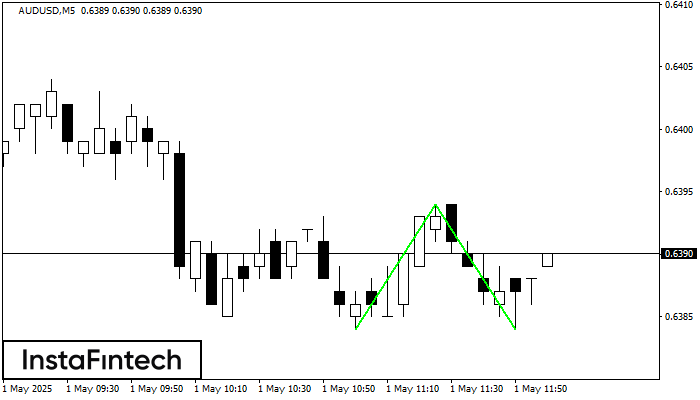
Pola Bawah Ganda telah terbentuk pada AUDUSD M5; batas atas di 0.6394; batas bawah di 0.6384. Lebar pola sebesar 10 poin. Jika harga menembus batas atas 0.6394, Perubahan dalam tren
Rangka waktu M5 dan M15 mungkin memiliki lebih dari titik entri yang keliru.
Open chart in a new window
Teratas Ganda
was formed on 01.05 at 11:00:08 (UTC+0)
signal strength 1 of 5
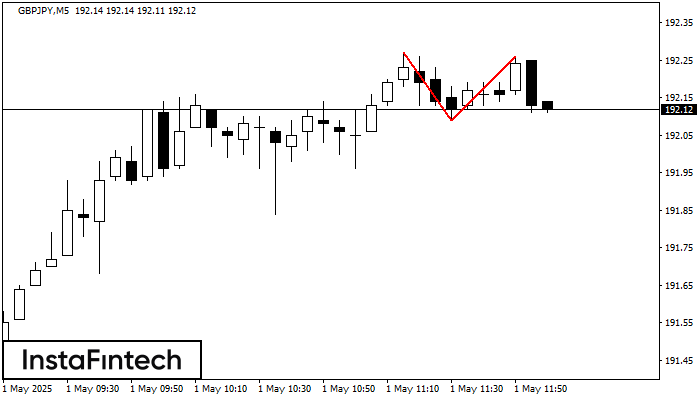
Pada grafik GBPJPY M5 pola reversal Teratas Ganda telah terbentuk. Karakteristik: batas atas 192.26; batas bawah 192.09; lebar pola 17 poin. Sinyal: tembusan ke batas bawah akan menyebabkan kelanjutan tren
Rangka waktu M5 dan M15 mungkin memiliki lebih dari titik entri yang keliru.
Open chart in a new window