Pola sebenarnya

Double Bottom
was formed on 28.04 at 21:20:55 (UTC+0)
signal strength 1 of 5
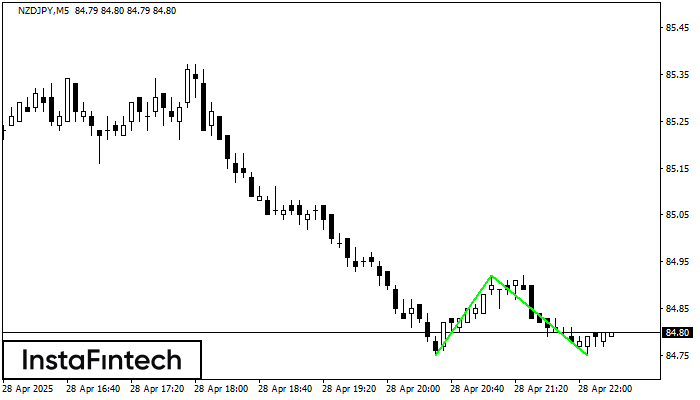
The Double Bottom pattern has been formed on NZDJPY M5. Characteristics: the support level 84.75; the resistance level 84.92; the width of the pattern 17 points. If the resistance level is broken, a change in the trend can be predicted with the first target point lying at the distance of 17 points.
The M5 and M15 time frames may have more false entry points.
- All
- All
- Bearish Rectangle
- Bearish Symmetrical Triangle
- Bearish Symmetrical Triangle
- Bullish Rectangle
- Double Top
- Double Top
- Triple Bottom
- Triple Bottom
- Triple Top
- Triple Top
- All
- All
- Buy
- Sale
- All
- 1
- 2
- 3
- 4
- 5
Persegi Bearish
was formed on 02.06 at 16:03:51 (UTC+0)
signal strength 5 of 5

Menurut grafik dari D1, #PEP terbentuk Persegi Bearish. Jenis pola ini menunjukkan kelanjutan tren. Terdiri dari dua tingkat: resistance 132.70 - 0.00 dan support 127.74 – 127.74. Jika level resistance
Open chart in a new window
Persegi Bearish
was formed on 02.06 at 16:03:49 (UTC+0)
signal strength 5 of 5
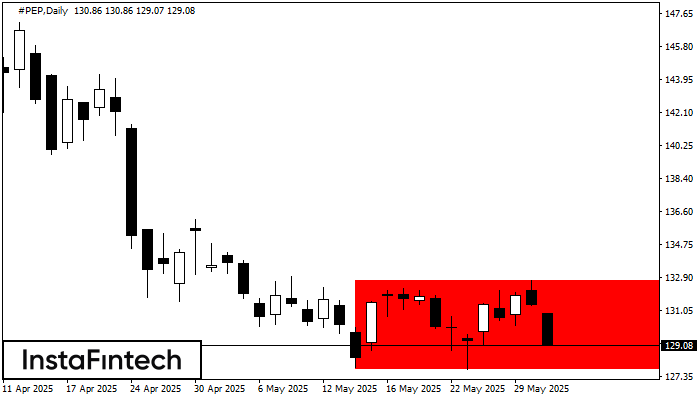
Menurut grafik dari D1, #PEP terbentuk Persegi Bearish yang merupakan pola dari kelanjutan tren. Pola terkandung di dalam batas berikut: batas lebih rendah 127.74 – 127.74 dan batas atas 132.70
Open chart in a new window
Bawah Ganda
was formed on 02.06 at 15:34:51 (UTC+0)
signal strength 1 of 5
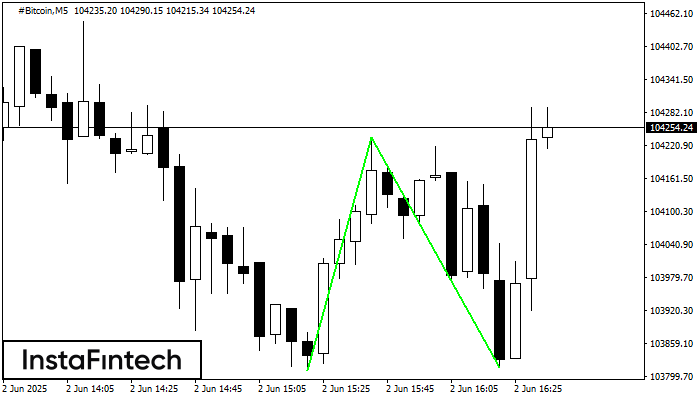
Pola Bawah Ganda telah terbentuk pada #Bitcoin M5; batas atas di 104236.07; batas bawah di 103815.25. Lebar pola sebesar 42583 poin. Jika harga menembus batas atas 104236.07, Perubahan dalam tren
Rangka waktu M5 dan M15 mungkin memiliki lebih dari titik entri yang keliru.
Open chart in a new window