यह भी देखें


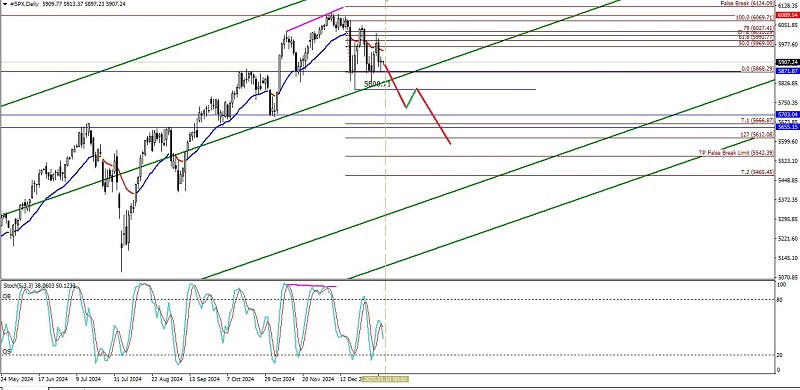
If we look at the daily chart of the S&P 500 index, it appears that #SPX is in a channel that is diving up, which means it is in a Bullish bias, but with EMA (21) moving in the middle of the candlestick body and diving down, indicating that it is currently Sideways but under selling pressure, where this condition has been confirmed by the appearance of deviations between the price movement of #SPX which previously formed Higher-High but on the contrary, the Stochastic Oscillator indicator actually formed Higher - Low so that in the next few days, it seems that Sellers are starting to enter, where this will provide the potential for weakening #SPX to test the level below its current price, namely level 5800.71. If this level is successfully broken and closes below it, #SPX will continue to weaken to 5666.87 and if the volatility and momentum of the weakening are strong enough, the area level 5612.08 - 5542.39 will be the next destination that will be tried to be tested by #SPX, but if on its way to the targets, there is suddenly a significant strengthening again, especially if it reaches penetrates and closes above the level of 6069.71, then the current weakening conditions will become invalid.
(Disclaimer)
You have already liked this post today
*यहां पर लिखा गया बाजार विश्लेषण आपकी जागरूकता बढ़ाने के लिए किया है, लेकिन व्यापार करने के लिए निर्देश देने के लिए नहीं |


