वास्तविक पैटर्न

पैटर्न ग्राफिकल मॉडल हैं जो चार्ट में मूल्य से बने होते हैं। तकनीकी विश्लेषण भविष्यवाणियों में से एक के अनुसार, इतिहास का मतलब मूल्य आंदोलन खुद को दोहराता है। इसका मतलब है कि मूल्य आंदोलन अक्सर एक ही परिस्थितियों में समान होते हैं जो उच्च संभावना के साथ स्थिति के आगे के विकास की भविष्यवाणी करना संभव बनाता है।
इंस्टा फॉरेक्स द्वारा प्रासंगिक पैटर्न एक उपयोग में आसान सेवा है जो आपको बाजार में नवीनतम परिवर्तनों के बारे में जागरूक होने और समय पर बाजार से संकेतों पर प्रतिक्रिया करने की अनुमति देती है। हमारी सेवा में आप हमेशा किसी भी जोड़ी और किसी भी समय सीमा पर नवीनतम और सबसे प्रासंगिक पैटर्न प्राप्त कर सकते हैं.
Bearish Symmetrical Triangle
was formed on 26.01 at 09:16:54 (UTC+0)
signal strength 3 of 5
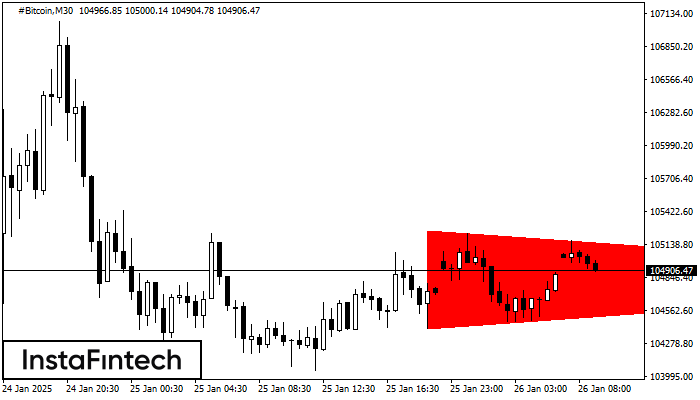
According to the chart of M30, #Bitcoin formed the Bearish Symmetrical Triangle pattern. Description: The lower border is 104410.08/104833.50 and upper border is 105255.76/104833.50. The pattern width is measured on the chart at -84568 pips. The formation of the Bearish Symmetrical Triangle pattern evidently signals a continuation of the downward trend. In other words, if the scenario comes true and #Bitcoin breaches the lower border, the price could continue its move toward 104833.20.
- All
- All
- Bearish Rectangle
- Bearish Symmetrical Triangle
- Bearish Symmetrical Triangle
- Bullish Rectangle
- Double Top
- Double Top
- Triple Bottom
- Triple Bottom
- Triple Top
- Triple Top
- All
- All
- Buy
- Sale
- All
- 1
- 2
- 3
- 4
- 5
बुलिश आयत
was formed on 31.05 at 19:15:46 (UTC+0)
signal strength 1 of 5

M5 के चार्ट के अनुसार, #Bitcoin से बुलिश आयत बना जो एक प्रवृत्ति निरंतरता का पैटर्न है। पैटर्न निम्न सीमाओं के भीतर समाहित है: निचली सीमा 104335.43 – 104335.43
M5 और M15 समय सीमा में अधिक फाल्स एंट्री पॉइंट्स हो सकते हैं।
Open chart in a new window
डबल बॉटम
was formed on 31.05 at 13:20:01 (UTC+0)
signal strength 1 of 5

डबल बॉटम पैटर्न #Bitcoin M5 पर बना है। विशेषताएं: समर्थन स्तर 103250.25; प्रतिरोध स्तर 103385.09; पैटर्न की चौड़ाई 13484 पॉइंट्स। यदि प्रतिरोध स्तर टूट जाता है, तो रुझान में बदलाव
M5 और M15 समय सीमा में अधिक फाल्स एंट्री पॉइंट्स हो सकते हैं।
Open chart in a new window
ट्रिपल टॉप
was formed on 30.05 at 22:20:23 (UTC+0)
signal strength 1 of 5

ट्रिपल टॉप पैटर्न GOLD M5 ट्रेडिंग इंस्ट्रूमेंट के चार्ट पर बना है। यह एक रीवर्सल पैटर्न है जिसमें निम्नलिखित विशेषताएं हैं: प्रतिरोध स्तर 4, समर्थन स्तर -193, और पैटर्न की
M5 और M15 समय सीमा में अधिक फाल्स एंट्री पॉइंट्स हो सकते हैं।
Open chart in a new window