वास्तविक पैटर्न

पैटर्न ग्राफिकल मॉडल हैं जो चार्ट में मूल्य से बने होते हैं। तकनीकी विश्लेषण भविष्यवाणियों में से एक के अनुसार, इतिहास का मतलब मूल्य आंदोलन खुद को दोहराता है। इसका मतलब है कि मूल्य आंदोलन अक्सर एक ही परिस्थितियों में समान होते हैं जो उच्च संभावना के साथ स्थिति के आगे के विकास की भविष्यवाणी करना संभव बनाता है।
इंस्टा फॉरेक्स द्वारा प्रासंगिक पैटर्न एक उपयोग में आसान सेवा है जो आपको बाजार में नवीनतम परिवर्तनों के बारे में जागरूक होने और समय पर बाजार से संकेतों पर प्रतिक्रिया करने की अनुमति देती है। हमारी सेवा में आप हमेशा किसी भी जोड़ी और किसी भी समय सीमा पर नवीनतम और सबसे प्रासंगिक पैटर्न प्राप्त कर सकते हैं.
Bearish Rectangle
was formed on 28.04 at 20:10:35 (UTC+0)
signal strength 1 of 5
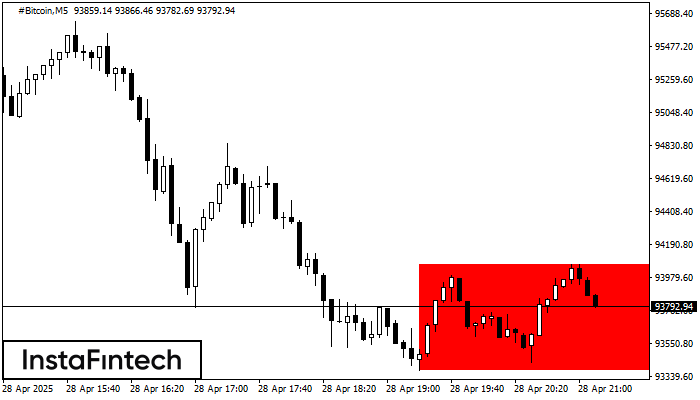
According to the chart of M5, #Bitcoin formed the Bearish Rectangle which is a pattern of a trend continuation. The pattern is contained within the following borders: lower border 93376.97 – 93376.97 and upper border 94063.13 – 94063.13. In case the lower border is broken, the instrument is likely to follow the downward trend.
The M5 and M15 time frames may have more false entry points.
- All
- All
- Bearish Rectangle
- Bearish Symmetrical Triangle
- Bearish Symmetrical Triangle
- Bullish Rectangle
- Double Top
- Double Top
- Triple Bottom
- Triple Bottom
- Triple Top
- Triple Top
- All
- All
- Buy
- Sale
- All
- 1
- 2
- 3
- 4
- 5
Triple Bottom
was formed on 30.05 at 09:00:12 (UTC+0)
signal strength 4 of 5
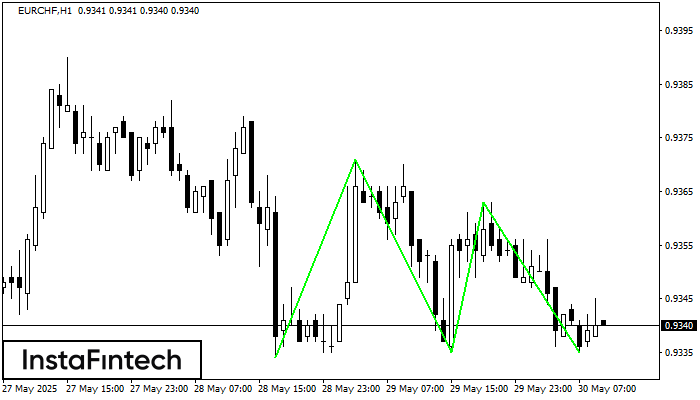
The Triple Bottom pattern has formed on the chart of EURCHF H1. Features of the pattern: The lower line of the pattern has coordinates 0.9371 with the upper limit 0.9371/0.9363
Open chart in a new window
Double Bottom
was formed on 30.05 at 08:30:30 (UTC+0)
signal strength 3 of 5
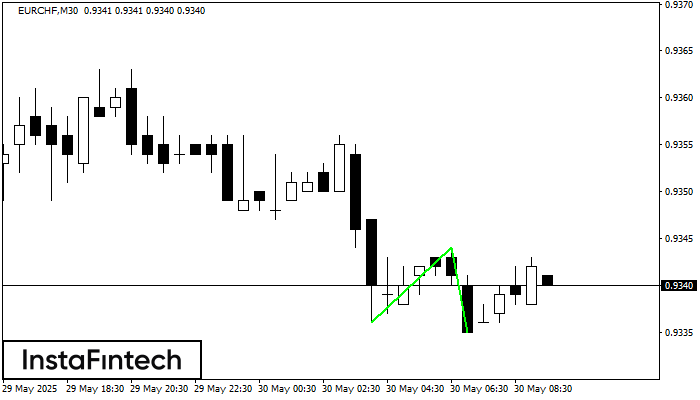
The Double Bottom pattern has been formed on EURCHF M30. This formation signals a reversal of the trend from downwards to upwards. The signal is that a buy trade should
Open chart in a new window
Inverse Head and Shoulder
was formed on 30.05 at 08:00:23 (UTC+0)
signal strength 3 of 5
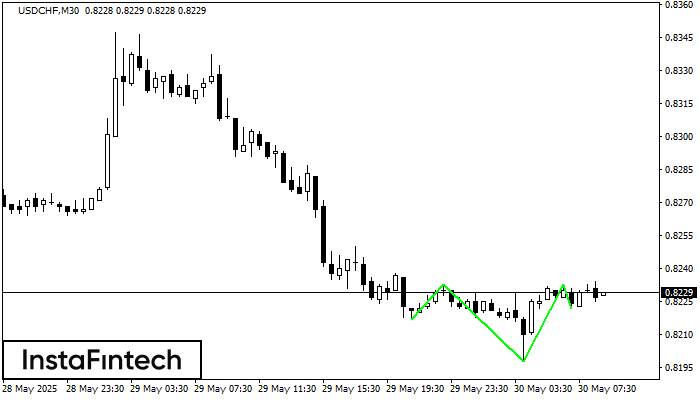
According to M30, USDCHF is shaping the technical pattern – the Inverse Head and Shoulder. In case the Neckline 0.8233/0.8233 is broken out, the instrument is likely to move toward
Open chart in a new window