Өзекті паттерндер

Тройная вершина
сформирован 24.03 в 14:29:45 (UTC+0)
сила сигнала 3 из 5
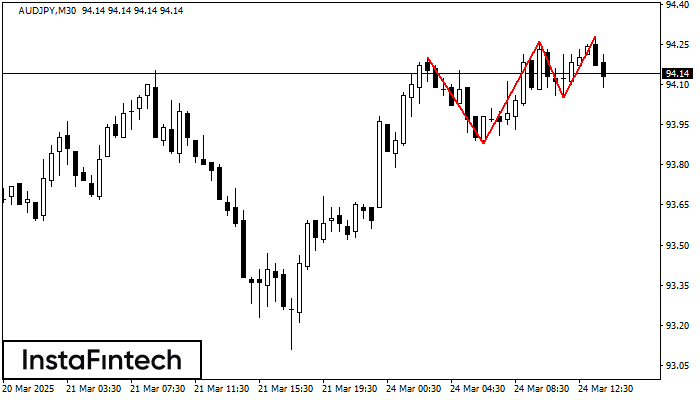
На графике AUDJPY M30 образовалась фигура «Тройная вершина». Данная фигура относится к типу разворотных и имеет характеристику: Верхняя граница 94.20/94.28; Нижняя граница 93.88/94.05; Ширина фигуры 21 пунктов. Прогноз: В случае пробоя нижней границы 93.88 вероятно дальнейшее нисходящее движение к уровню 93.96.
Сондай-ақ қараңыз
- Все
- Все
- Bearish Rectangle
- Bearish Symmetrical Triangle
- Bearish Symmetrical Triangle
- Bullish Rectangle
- Double Top
- Double Top
- Triple Bottom
- Triple Bottom
- Triple Top
- Triple Top
- Все
- Все
- Покупка
- Продажа
- Все
- 1
- 2
- 3
- 4
- 5
Bearish Flag
was formed on 01.04 at 12:50:23 (UTC+0)
signal strength 1 of 5

The Bearish Flag pattern has been formed on the chart USDCHF M5. Therefore, the downwards trend is likely to continue in the nearest term. As soon as the price breaks
The M5 and M15 time frames may have more false entry points.
Open chart in a new window
Bearish pennant
was formed on 01.04 at 12:50:18 (UTC+0)
signal strength 1 of 5
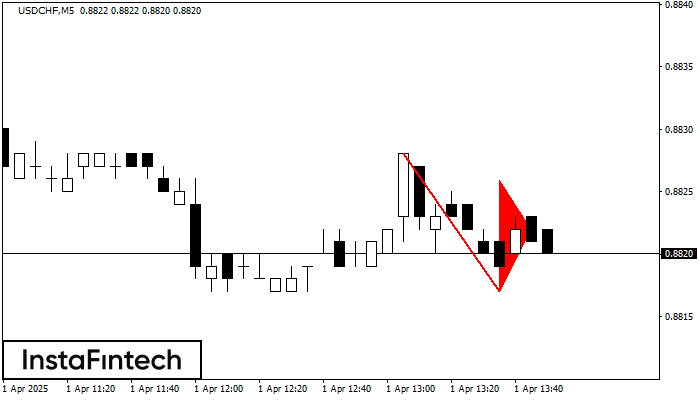
The Bearish pennant pattern has formed on the USDCHF M5 chart. It signals potential continuation of the existing trend. Specifications: the pattern’s bottom has the coordinate of 0.8817; the projection
The M5 and M15 time frames may have more false entry points.
Open chart in a new window
Bullish Symmetrical Triangle
was formed on 01.04 at 11:03:47 (UTC+0)
signal strength 3 of 5

According to the chart of M30, GBPUSD formed the Bullish Symmetrical Triangle pattern. The lower border of the pattern touches the coordinates 1.2876/1.2915 whereas the upper border goes across 1.2971/1.2915
Open chart in a new window