Өзекті паттерндер

Тройная вершина
сформирован 08.04 в 01:40:24 (UTC+0)
сила сигнала 1 из 5
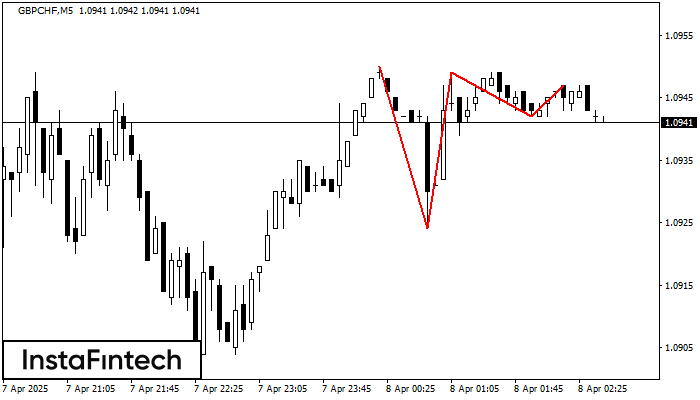
На графике GBPCHF M5 образовалась фигура «Тройная вершина». Данная фигура относится к типу разворотных и имеет характеристику: Верхняя граница 1.0950/1.0947; Нижняя граница 1.0924/1.0942; Ширина фигуры 7 пунктов. Прогноз: В случае пробоя нижней границы 1.0924 вероятно дальнейшее нисходящее движение к уровню 1.0934.
Таймфреймы М5 и М15 могут иметь больше ложных точек входа.
Сондай-ақ қараңыз
- Все
- Все
- Bearish Rectangle
- Bearish Symmetrical Triangle
- Bearish Symmetrical Triangle
- Bullish Rectangle
- Double Top
- Double Top
- Triple Bottom
- Triple Bottom
- Triple Top
- Triple Top
- Все
- Все
- Покупка
- Продажа
- Все
- 1
- 2
- 3
- 4
- 5
Bullish Symmetrical Triangle
сформирован 15.04 в 00:15:23 (UTC+0)
сила сигнала 2 из 5
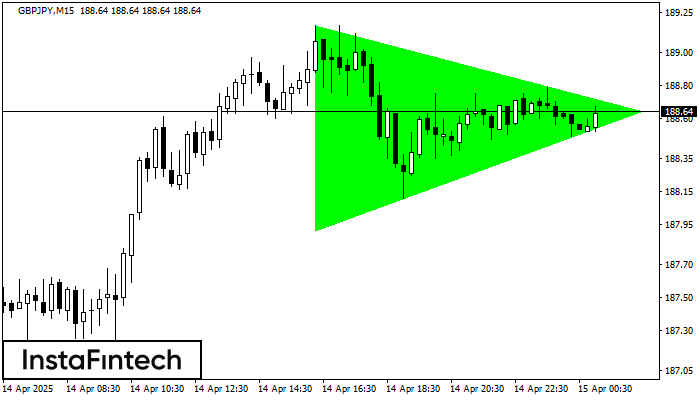
According to the chart of M15, GBPJPY formed the Bullish Symmetrical Triangle pattern. The lower border of the pattern touches the coordinates 187.91/188.64 whereas the upper border goes across 189.17/188.64
The M5 and M15 time frames may have more false entry points.
Открыть график инструмента в новом окне
Double Top
сформирован 15.04 в 00:11:12 (UTC+0)
сила сигнала 1 из 5

On the chart of EURCAD M5 the Double Top reversal pattern has been formed. Characteristics: the upper boundary 1.5775; the lower boundary 1.5763; the width of the pattern 12 points
The M5 and M15 time frames may have more false entry points.
Открыть график инструмента в новом окне
Inverse Head and Shoulder
сформирован 14.04 в 23:05:42 (UTC+0)
сила сигнала 1 из 5
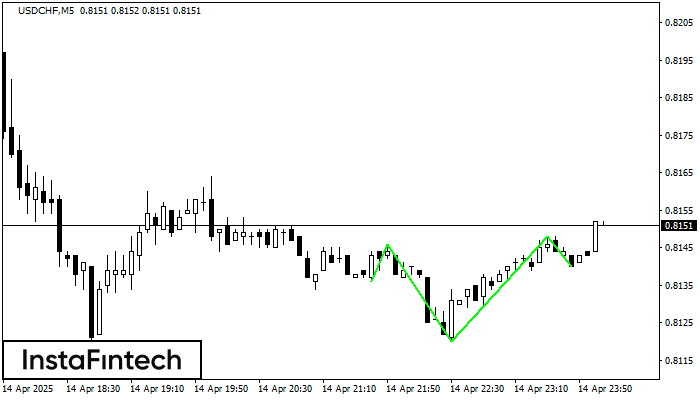
According to the chart of M5, USDCHF formed the Inverse Head and Shoulder pattern. The Head’s top is set at 0.8148 while the median line of the Neck is found
The M5 and M15 time frames may have more false entry points.
Открыть график инструмента в новом окне