Өзекті паттерндер

Тройная вершина
сформирован 11.04 в 06:30:13 (UTC+0)
сила сигнала 3 из 5
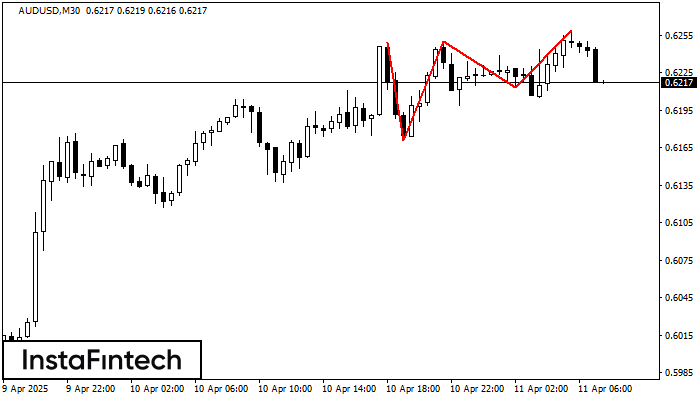
На графике AUDUSD M30 образовалась фигура «Тройная вершина». Данная фигура относится к типу разворотных и имеет характеристику: Верхняя граница 0.6249/0.6259; Нижняя граница 0.6171/0.6213; Ширина фигуры 37 пунктов. Прогноз: В случае пробоя нижней границы 0.6171 вероятно дальнейшее нисходящее движение к уровню 0.6220.
Сондай-ақ қараңыз
- Все
- Все
- Bearish Rectangle
- Bearish Symmetrical Triangle
- Bearish Symmetrical Triangle
- Bullish Rectangle
- Double Top
- Double Top
- Triple Bottom
- Triple Bottom
- Triple Top
- Triple Top
- Все
- Все
- Покупка
- Продажа
- Все
- 1
- 2
- 3
- 4
- 5
Double Bottom
was formed on 01.05 at 08:10:21 (UTC+0)
signal strength 1 of 5
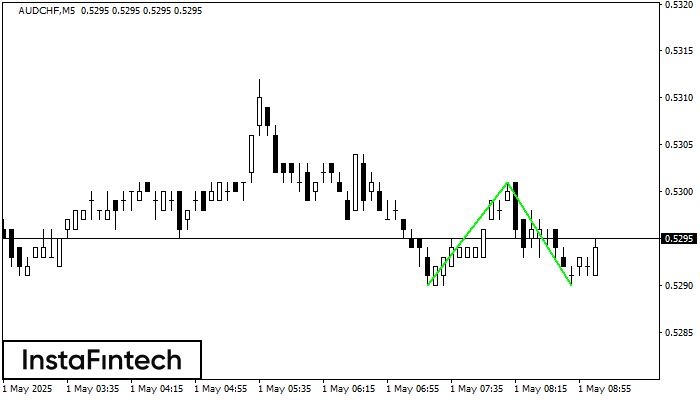
The Double Bottom pattern has been formed on AUDCHF M5. Characteristics: the support level 0.5290; the resistance level 0.5301; the width of the pattern 11 points. If the resistance level
The M5 and M15 time frames may have more false entry points.
Open chart in a new window
Double Bottom
was formed on 01.05 at 08:05:08 (UTC+0)
signal strength 1 of 5
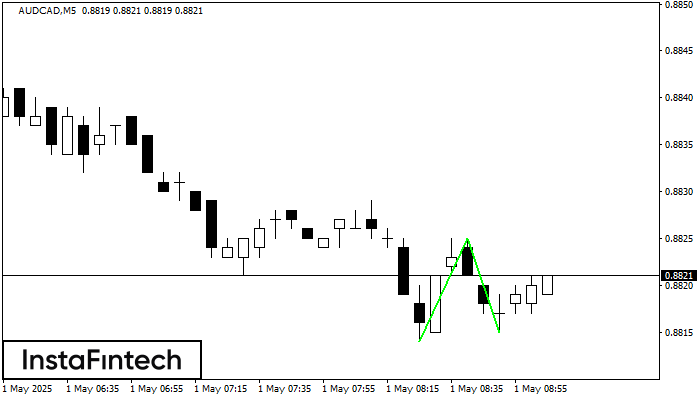
The Double Bottom pattern has been formed on AUDCAD M5. Characteristics: the support level 0.8814; the resistance level 0.8825; the width of the pattern 11 points. If the resistance level
The M5 and M15 time frames may have more false entry points.
Open chart in a new window
Double Top
was formed on 01.05 at 08:00:10 (UTC+0)
signal strength 2 of 5
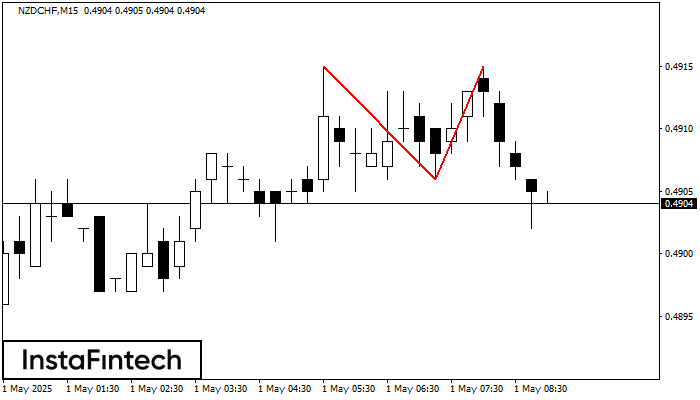
The Double Top reversal pattern has been formed on NZDCHF M15. Characteristics: the upper boundary 0.4915; the lower boundary 0.4906; the width of the pattern is 9 points. Sell trades
The M5 and M15 time frames may have more false entry points.
Open chart in a new window