Өзекті паттерндер

Двойное дно
сформирован 17.04 в 18:00:01 (UTC+0)
сила сигнала 1 из 5
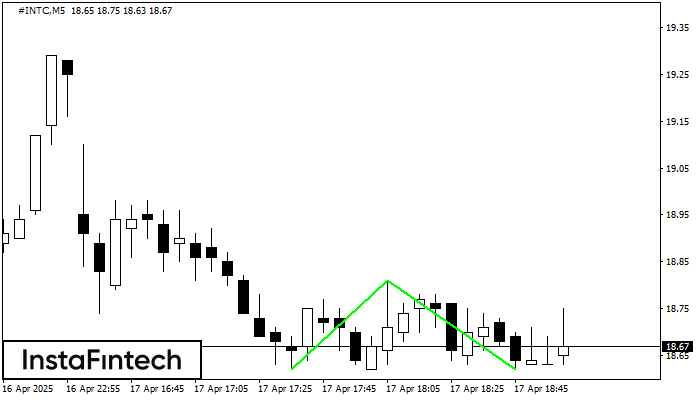
Сформирована фигура «Двойное дно» на графике #INTC M5. Верхняя граница 18.81; Нижняя граница 18.62; Ширина фигуры 19 пунктов. В случае пробоя верхней границы 18.81 можно будет прогнозировать изменение тенденции, где ширина фигуры и будет являться расстоянием предположительного Тейк Профита.
Таймфреймы М5 и М15 могут иметь больше ложных точек входа.
Сондай-ақ қараңыз
- Все
- Все
- Bearish Rectangle
- Bearish Symmetrical Triangle
- Bearish Symmetrical Triangle
- Bullish Rectangle
- Double Top
- Double Top
- Triple Bottom
- Triple Bottom
- Triple Top
- Triple Top
- Все
- Все
- Покупка
- Продажа
- Все
- 1
- 2
- 3
- 4
- 5
Triple Bottom
сформирован 01.05 в 17:39:48 (UTC+0)
сила сигнала 1 из 5

The Triple Bottom pattern has been formed on #KO M5. It has the following characteristics: resistance level 71.64/71.57; support level 71.39/71.35; the width is 25 points. In the event
The M5 and M15 time frames may have more false entry points.
Открыть график инструмента в новом окне
Inverse Head and Shoulder
сформирован 01.05 в 17:30:04 (UTC+0)
сила сигнала 1 из 5

According to M5, NZDCAD is shaping the technical pattern – the Inverse Head and Shoulder. In case the Neckline 0.8179/0.8176 is broken out, the instrument is likely to move toward
The M5 and M15 time frames may have more false entry points.
Открыть график инструмента в новом окне
Bullish pennant
сформирован 01.05 в 16:40:46 (UTC+0)
сила сигнала 1 из 5
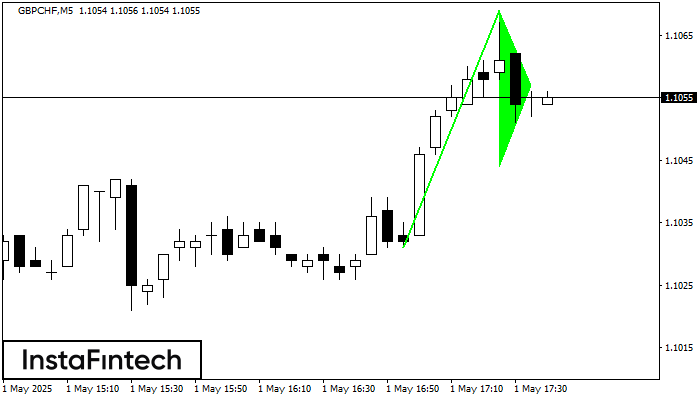
The Bullish pennant signal – Trading instrument GBPCHF M5, continuation pattern. Forecast: it is possible to set up a buy position above the pattern’s high of 1.1069, with the prospect
The M5 and M15 time frames may have more false entry points.
Открыть график инструмента в новом окне