Өзекті паттерндер

Бычий вымпел
сформирован 23.04 в 20:00:19 (UTC+0)
сила сигнала 3 из 5
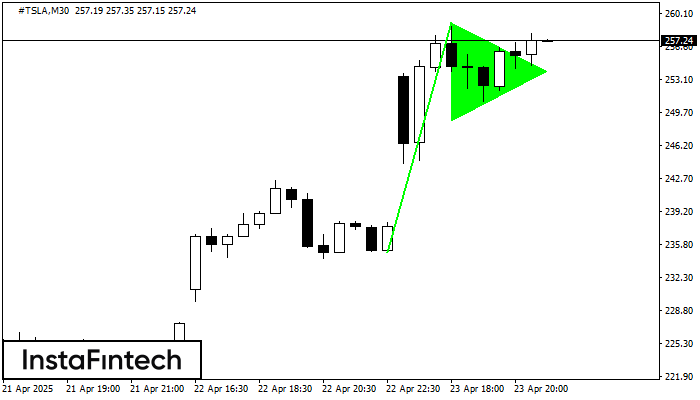
Графическая фигура «Бычий вымпел» сформировалась по инструменту #TSLA на M30. Данный вид фигуры относится к типу продолжения тенденции. В случае если котировке удастся преодолеть максимум вымпела 259.18, то ожидается продолжение восходящего тренда к уровню 259.48.
Сондай-ақ қараңыз
- Все
- Все
- Bearish Rectangle
- Bearish Symmetrical Triangle
- Bearish Symmetrical Triangle
- Bullish Rectangle
- Double Top
- Double Top
- Triple Bottom
- Triple Bottom
- Triple Top
- Triple Top
- Все
- Все
- Покупка
- Продажа
- Все
- 1
- 2
- 3
- 4
- 5
Double Top
сформирован 09.06 в 23:00:25 (UTC+0)
сила сигнала 4 из 5
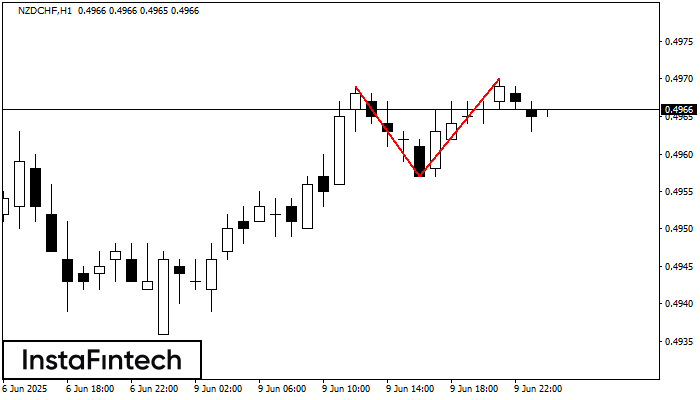
On the chart of NZDCHF H1 the Double Top reversal pattern has been formed. Characteristics: the upper boundary 0.4970; the lower boundary 0.4957; the width of the pattern 13 points
Открыть график инструмента в новом окне
Double Top
сформирован 09.06 в 21:45:52 (UTC+0)
сила сигнала 1 из 5
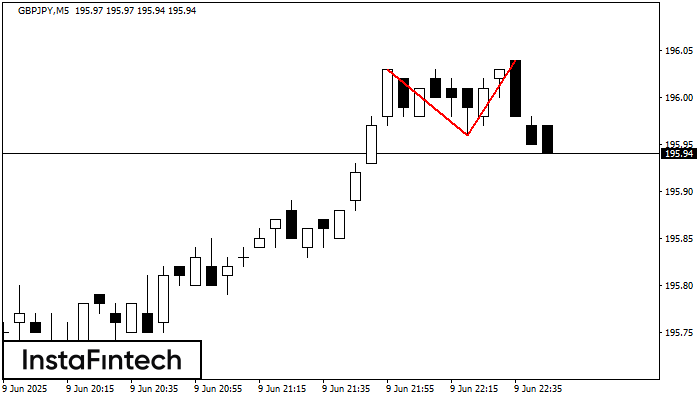
On the chart of GBPJPY M5 the Double Top reversal pattern has been formed. Characteristics: the upper boundary 196.04; the lower boundary 195.96; the width of the pattern 8 points
The M5 and M15 time frames may have more false entry points.
Открыть график инструмента в новом окне
Triple Top
сформирован 09.06 в 21:45:21 (UTC+0)
сила сигнала 2 из 5

On the chart of the NZDCHF M15 trading instrument, the Triple Top pattern that signals a trend change has formed. It is possible that after formation of the third peak
The M5 and M15 time frames may have more false entry points.
Открыть график инструмента в новом окне