Lihat juga


 02.01.2023 12:20 PM
Trend-following analysis
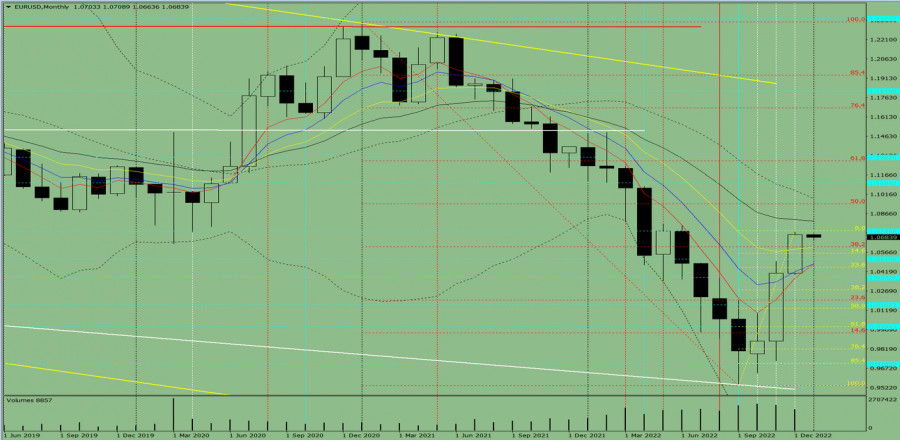
In January, EUR/USD is expected to move higher from 1.0706, the level of closing the December one-month high, to the target at 1.0941, which is the 50.0% Fibonacci retracement level plotted by the red dotted line. Once this level is tested, the instrument will continue its rise to 1.1104, the historic resistance level plotted by the blue dotted line. After this level is tested, we could expect a downward retracement.
Picture 1, one-month chart
Indicator analysis
The conclusion from the complex analysis is that EUR/USD is likely to trade higher.
The one-month chart of EUR/USD draws traders to the conclusion that the overall trend is going to be bullish. The one-month white candlestick lacks the first lower shadow in the first week. The second upper shadow is also missing on the final week.
The basic scenario. EUR/USD is expected to move higher from 1.0706, the level of closing the December one-month candlestick, to the target at 1.0941, which is the 50.0% Fibonacci retracement level plotted by the red dotted line. Once this level is tested, the instrument will continue its rise to 1.1104, the historic resistance level plotted by the blue dotted line. After this level is tested, we could expect a downward retracement.
Alternative scenario. EUR/USD might also move higher from 1.0706, the level of closing the December one-month candlestick, towards the target of 1.0941, which is the 50.0% Fibonacci retracement level plotted by the red dotted line. After this level is tested, the price will retrace downwards. 1.0809 serves as a 21-period moving average plotted by the black thin line.
You have already liked this post today
* Analisis pasaran yang disiarkan di sini adalah bertujuan untuk meningkatkan kesedaran anda, tetapi tidak untuk memberi arahan untuk membuat perdagangan.
Bitcoin kini didagangkan sekitar 110,726, mengalami pembetulan teknikal selepas mencapai 110,726, satu tahap yang dilihat pada penghujung Mei. Bitcoin telah membentuk corak dua puncak, jadi kami percaya bahawa jika
Pada hari Isnin, pasangan EUR/USD didagangkan secara mendatar antara paras 1.1380 dan 1.1454, membentuk satu julat. Oleh demikian, lantunan dari zon sokongan 1.1374–1.1380 akan memihak kepada euro dan menyokong pertumbuhan
Dengan kemunculan corak Ascending Broadening Wedge yang diikuti oleh kemunculan corak Bearish 123, ini memberikan petunjuk bahawa dalam masa terdekat, pasangan EUR/USD berpotensi untuk melemah, terutamanya dengan pengesahan kemunculan perbezaan
Pada carta 4 jam pasangan mata wang silang GBP/JPY, terdapat beberapa perkara menarik yang dapat diperhatikan. Pertama, pergerakan harga bergerak di atas WMA (21) yang mempunyai cerun yang bergerak
Dolar Australia telah menunjukkan pertumbuhan yang sederhana melebihi satu angka dalam tempoh 10 hari yang lalu, tetapi keengganan pengayun Marlin untuk mengikuti pergerakan menaik ini menimbulkan kebimbangan dalam kalangan pasaran
Awal sesi Amerika, emas didagangkan sekitar 3,317, melantun selepas mencapai paras rendah 3,294 semasa sesi Eropah. Pada carta H4, emas boleh terus meningkat dan boleh mencapai 21SMA yang terletak sekitar
Your IP address shows that you are currently located in the USA. If you are a resident of the United States, you are prohibited from using the services of InstaFintech Group including online trading, online transfers, deposit/withdrawal of funds, etc.
If you think you are seeing this message by mistake and your location is not the US, kindly proceed to the website. Otherwise, you must leave the website in order to comply with government restrictions.
Why does your IP address show your location as the USA?
Please confirm whether you are a US resident or not by clicking the relevant button below. If you choose the wrong option, being a US resident, you will not be able to open an account with InstaTrade anyway.
We are sorry for any inconvenience caused by this message.

