Lihat juga


 24.01.2025 10:21 AM
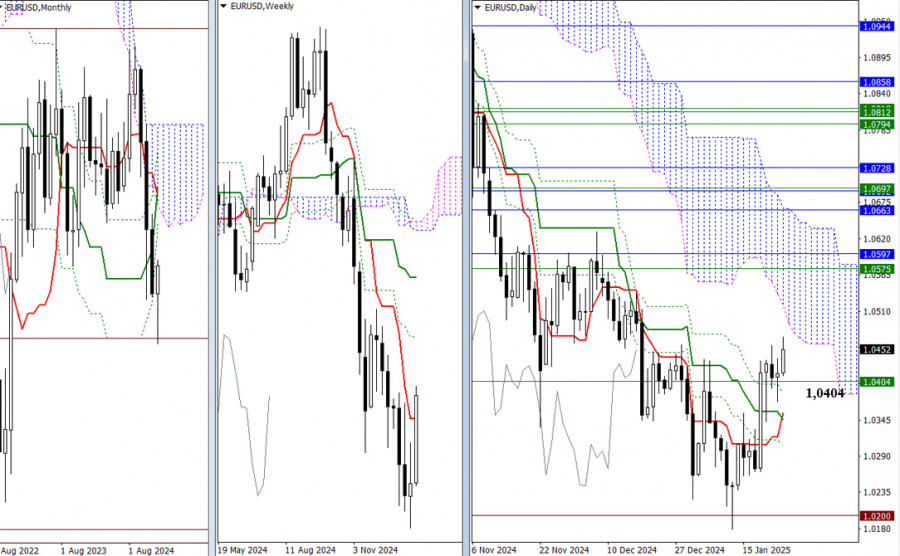
Bullish traders are looking to maintain their current positions and potentially push the pair higher. Since today is Friday, the weekly close will be significant. An ideal scenario for the bulls would be a weekly candle with minimal upper shadow. The nearest upward target is the lower boundary of the daily Ichimoku cloud at 1.0520, followed by weekly resistance at 1.0575 and monthly resistance at 1.0597. On the other hand, bearish traders are focused on the influence zone of the weekly short-term trend at 1.0404. Trading below this level would lead to a test of the daily Ichimoku cross supports at 1.0385, 1.0355, 1.0346, and 1.0307. If the cross is broken, bearish plans may resume, targeting 1.0179.
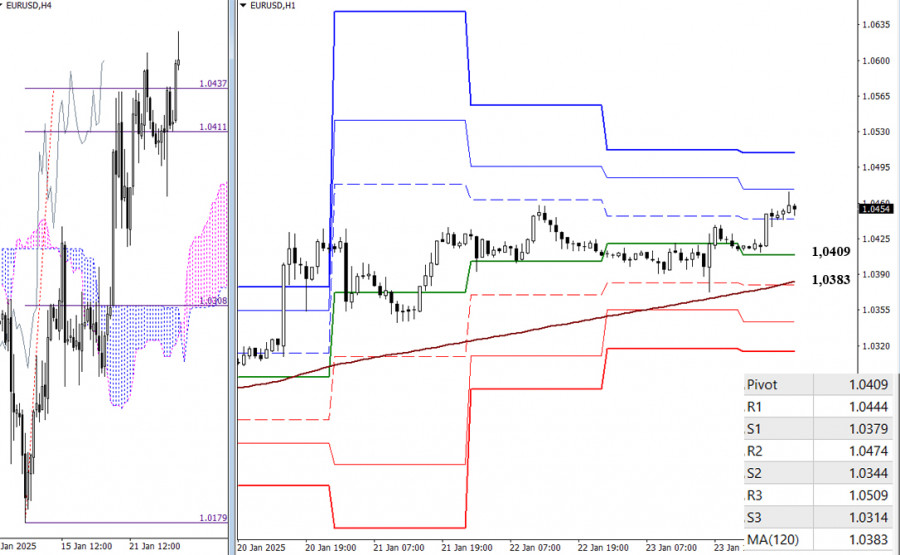
On the lower timeframes, bullish traders still hold the primary advantage and are attempting to break through the tested H4 Ichimoku cloud breakout target at 1.0437 to continue their upward movement. Intraday bullish targets include the classic Pivot resistance levels, with R2 at 1.0474 and R3 at 1.0509, which have not yet been reached today. However, a corrective decline and a break below the key levels converging around 1.0409 to 1.0383 (daily central Pivot level plus weekly long-term trend) could disrupt the current balance of power. Such a shift would render bearish intraday targets relevant again, including support levels at the classic Pivot points (1.0379, 1.0344, 1.0314).
***
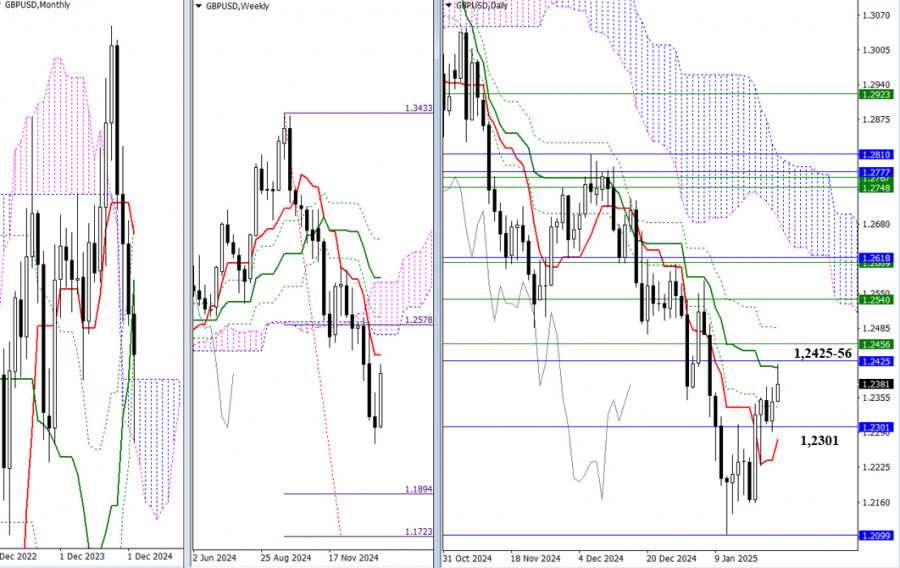
On the last trading day of the week, bullish players have begun testing resistance levels clustered around 1.2411, 1.2425, 1.2456, and 1.2485. A successful breakout above these levels would enable bulls to achieve key objectives, such as overcoming the daily Ichimoku dead cross and regaining the weekly short-term trend. However, if the bulls fail to break through, the pair will likely interact with the nearest support zone at 1.2338, 1.2301, and 1.2277, which correspond to the daily Ichimoku cross levels and the upper boundary of the monthly Ichimoku cloud.
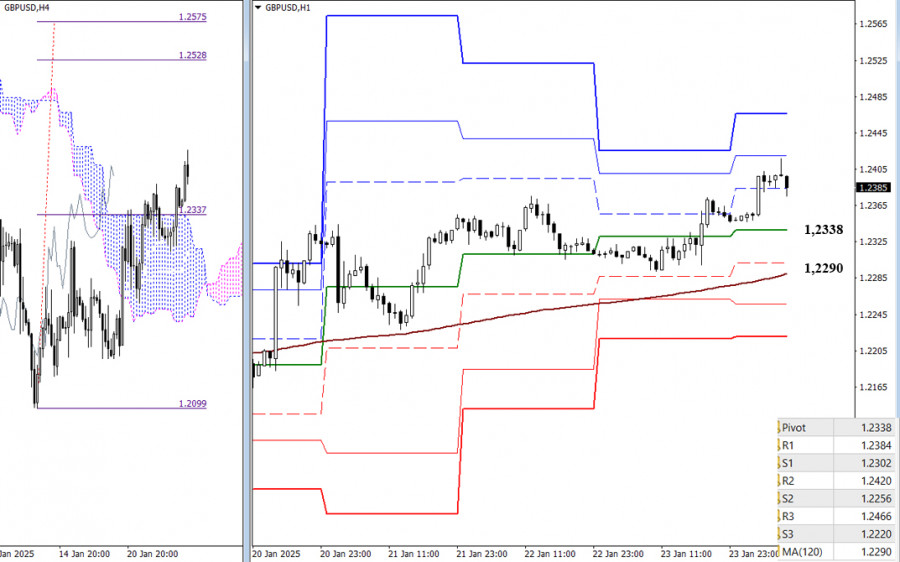
Bullish players continue to hold the advantage on lower timeframes. On the H4 chart, an upward target has been established for breaking the Ichimoku cloud at 1.2528 and 1.2575. Additional intraday resistance levels include the classic Pivot levels at 1.2420 and 1.2446. Key levels to watch today are at 1.2338 and 1.2290, which correspond to the daily central Pivot level and the weekly long-term trend. A break below these levels could lead to a trend reversal, altering the current balance of power. Additional targets for bearish players include the classic Pivot support levels at 1.2302, 1.2256, and 1.2220.
***
You have already liked this post today
* Analisis pasaran yang disiarkan di sini adalah bertujuan untuk meningkatkan kesedaran anda, tetapi tidak untuk memberi arahan untuk membuat perdagangan.
Indeks Dolar A.S., yang menjejaki prestasi dolar A.S. terhadap satu bakul mata wang utama, terus berdagang dengan kecenderungan menurun untuk hari kedua berturut-turut. Indeks Kekuatan Relatif (RSI) pada carta harian
Dalam tempoh empat hari yang lalu, harga gagal menembusi paras rintangan pada 1.4010, meskipun tidak menunjukkan cubaan yang ketara. Semalam, harga berundur dari kawasan persilangan antara garisan keseimbangan (balance line)
Pengukuhan tujuh hari Bitcoin di atas paras 102,698 nampaknya hampir berakhir. Kita kini menunggu pengesahan akhir daripada pengayun Marlin, yang perlu melantun dari sempadan bawah saluran menaiknya. Sasaran kenaikan seterusnya
Pada awal sesi dagangan Amerika, Bitcoin diniagakan sekitar 102,746, berada di bawah Purata Bergerak 21-hari (SMA 21), dan di bawah paras +1/8 Murray, menunjukkan tanda-tanda keletihan momentum. Bitcoin kini didagangkan
Kelab InstaTrade

Your IP address shows that you are currently located in the USA. If you are a resident of the United States, you are prohibited from using the services of InstaFintech Group including online trading, online transfers, deposit/withdrawal of funds, etc.
If you think you are seeing this message by mistake and your location is not the US, kindly proceed to the website. Otherwise, you must leave the website in order to comply with government restrictions.
Why does your IP address show your location as the USA?
Please confirm whether you are a US resident or not by clicking the relevant button below. If you choose the wrong option, being a US resident, you will not be able to open an account with InstaTrade anyway.
We are sorry for any inconvenience caused by this message.


