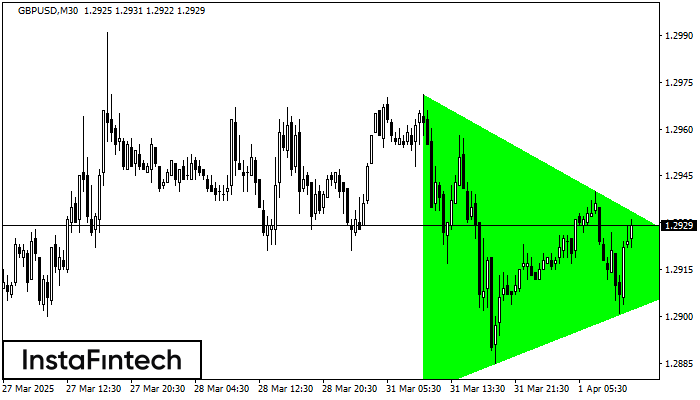
Bullish Symmetrical Triangle
was formed on 01.04 at 11:03:47 (UTC+0)
signal strength 3 of 5

According to the chart of M30, GBPUSD formed the Bullish Symmetrical Triangle pattern. The lower border of the pattern touches the coordinates 1.2876/1.2915 whereas the upper border goes across 1.2971/1.2915. If the Bullish Symmetrical Triangle pattern is in progress, this evidently signals a further upward trend. In other words, in case the scenario comes true, the price of GBPUSD will breach the upper border to head for 1.2945.
Juga lihat
- All
- All
- Bearish Rectangle
- Bearish Symmetrical Triangle
- Bearish Symmetrical Triangle
- Bullish Rectangle
- Double Top
- Double Top
- Triple Bottom
- Triple Bottom
- Triple Top
- Triple Top
- All
- All
- Buy
- Sale
- All
- 1
- 2
- 3
- 4
- 5
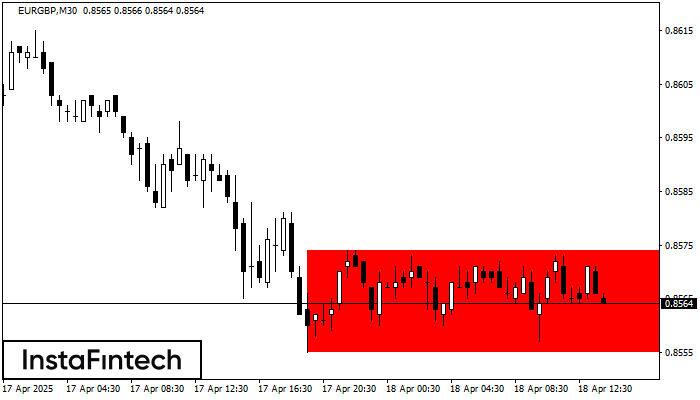
Segi Empat Menurun
was formed on 18.04 at 13:00:27 (UTC+0)
signal strength 3 of 5
Berdasarkan carta M30, EURGBP telah membentuk Segi Empat Menurun. Jenis corak ini menunjukkan kesinambungan aliran. Ia terdiri daripada dua tahap: rintangan 0.8574 - 0.0000 dan sokongan 0.8555 – 0.8555. Sekiranya
Open chart in a new window
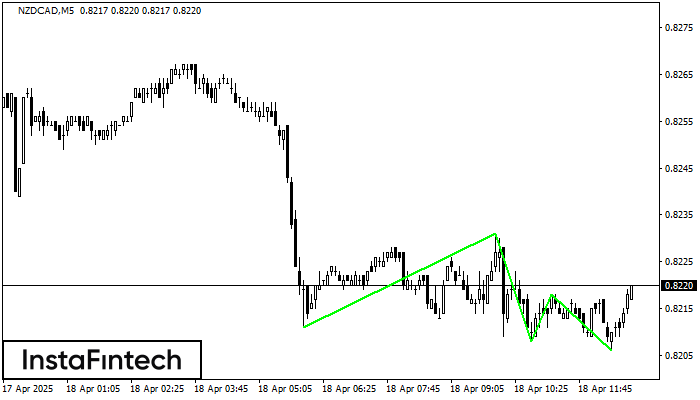
Triple Bottom
was formed on 18.04 at 11:50:33 (UTC+0)
signal strength 1 of 5
Corak Triple Bottom telah dibentuk pada carta bagi instrumen dagangan NZDCAD M5. Corak menandakan perubahan aliran dari menurun ke aliran menaik dalam sekiranya penembusan 0.8231/0.8218
Carta masa M5 dan M15 mungkin mempunyai lebih banyak titik kemasukan palsu.
Open chart in a new window
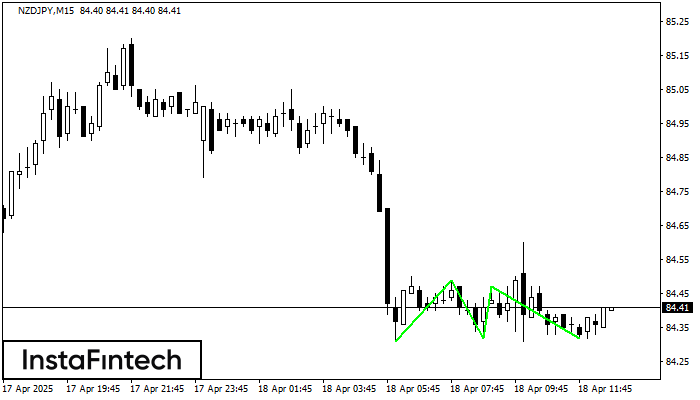
Triple Bottom
was formed on 18.04 at 11:45:33 (UTC+0)
signal strength 2 of 5
Corak Triple Bottom telah dibentuk pada NZDJPY M15. Ia mempunyai ciri-ciri berikut: tahap rintangan 84.49/84.47; tahap sokongan 84.31/84.32; lebar corak adalah 18 mata. Dalam situasi penembusan paras rintangan 84.49, harga
Carta masa M5 dan M15 mungkin mempunyai lebih banyak titik kemasukan palsu.
Open chart in a new window


