Corak sebenar

Double Top
was formed on 04.04 at 21:55:03 (UTC+0)
signal strength 1 of 5
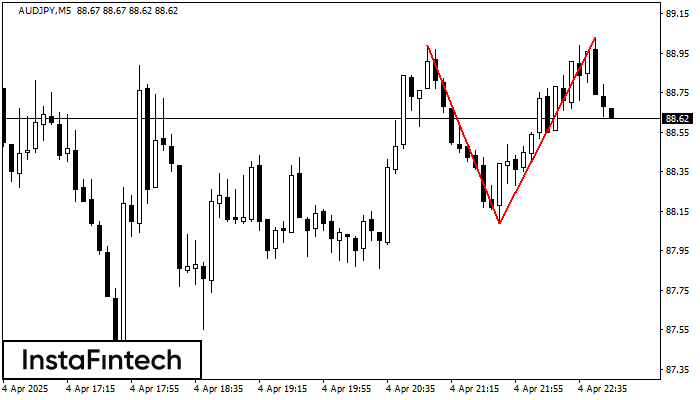
The Double Top pattern has been formed on AUDJPY M5. It signals that the trend has been changed from upwards to downwards. Probably, if the base of the pattern 88.09 is broken, the downward movement will continue.
The M5 and M15 time frames may have more false entry points.
Juga lihat
- All
- All
- Bearish Rectangle
- Bearish Symmetrical Triangle
- Bearish Symmetrical Triangle
- Bullish Rectangle
- Double Top
- Double Top
- Triple Bottom
- Triple Bottom
- Triple Top
- Triple Top
- All
- All
- Buy
- Sale
- All
- 1
- 2
- 3
- 4
- 5
Bearish Rectangle
сформирован 18.04 в 13:00:27 (UTC+0)
сила сигнала 3 из 5

According to the chart of M30, EURGBP formed the Bearish Rectangle. This type of a pattern indicates a trend continuation. It consists of two levels: resistance 0.8574 - 0.0000
Открыть график инструмента в новом окне
Triple Bottom
сформирован 18.04 в 11:50:33 (UTC+0)
сила сигнала 1 из 5

The Triple Bottom pattern has formed on the chart of the NZDCAD M5 trading instrument. The pattern signals a change in the trend from downwards to upwards in the case
The M5 and M15 time frames may have more false entry points.
Открыть график инструмента в новом окне
Triple Bottom
сформирован 18.04 в 11:45:33 (UTC+0)
сила сигнала 2 из 5

The Triple Bottom pattern has been formed on NZDJPY M15. It has the following characteristics: resistance level 84.49/84.47; support level 84.31/84.32; the width is 18 points. In the event
The M5 and M15 time frames may have more false entry points.
Открыть график инструмента в новом окне