Corak sebenar

Bullish Rectangle
was formed on 17.04 at 05:00:58 (UTC+0)
signal strength 3 of 5

According to the chart of M30, EURGBP formed the Bullish Rectangle. This type of a pattern indicates a trend continuation. It consists of two levels: resistance 0.8615 and support 0.8598. In case the resistance level 0.8615 - 0.8615 is broken, the instrument is likely to follow the bullish trend.
- All
- All
- Bearish Rectangle
- Bearish Symmetrical Triangle
- Bearish Symmetrical Triangle
- Bullish Rectangle
- Double Top
- Double Top
- Triple Bottom
- Triple Bottom
- Triple Top
- Triple Top
- All
- All
- Buy
- Sale
- All
- 1
- 2
- 3
- 4
- 5
Double Top
was formed on 06.07 at 03:30:50 (UTC+0)
signal strength 2 of 5
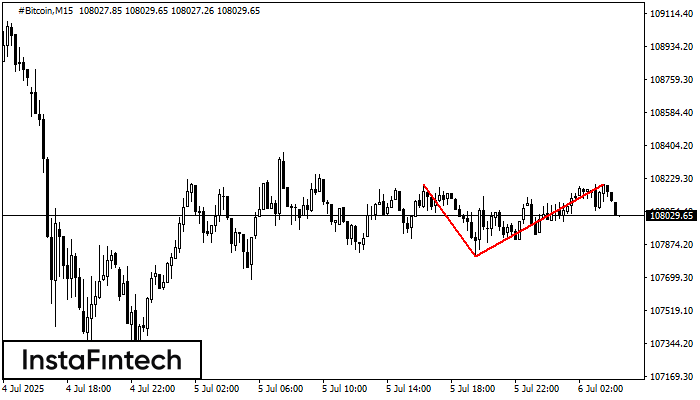
Pada carta #Bitcoin M15 corak pembalikan Double Top telah terbentuk. Ciri-ciri: sempadan atas 108196.50; sempadan bawah 107810.44; lebar corak 38606 mata. Isyarat: penembusan sempadan bawah akan menyebabkan kesinambungan arah aliran
Carta masa M5 dan M15 mungkin mempunyai lebih banyak titik kemasukan palsu.
Open chart in a new window
Double Top
was formed on 06.07 at 03:06:04 (UTC+0)
signal strength 1 of 5
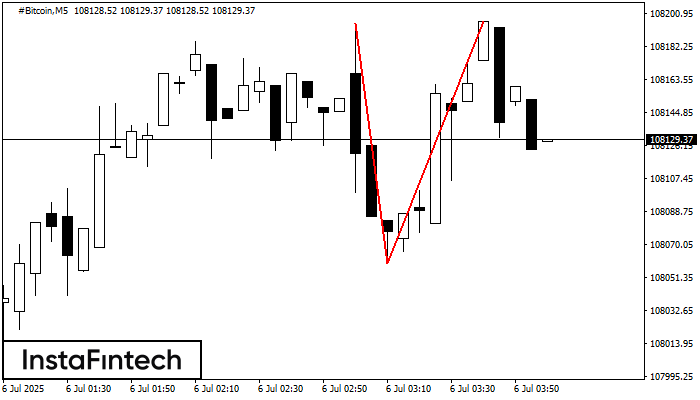
Corak Double Top telah dibentuk pada #Bitcoin M5. Isyarat bahawa aliran telah berubah dari aliran menaik ke aliran menurun. Mungkin, sekiranya asas corak 108059.29 ditembusi, pergerakan menurun akan berterusan
Carta masa M5 dan M15 mungkin mempunyai lebih banyak titik kemasukan palsu.
Open chart in a new window
Segi Tiga Simetri Menurun
was formed on 05.07 at 20:09:52 (UTC+0)
signal strength 1 of 5

Berdasarkan carta M5, #Bitcoin membentuk corak Segi Tiga Simetri Menurun. Cadangan dagangan: Penembusan sempadan bawah 107810.44 mungkin mendorong kepada kesinambungan aliran menurun
Carta masa M5 dan M15 mungkin mempunyai lebih banyak titik kemasukan palsu.
Open chart in a new window