Долзарб паттернлар

Двойная вершина
сформирован 03.04 в 09:29:55 (UTC+0)
сила сигнала 3 из 5
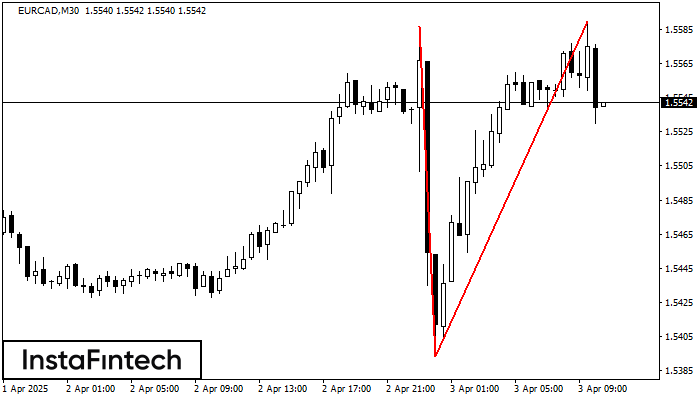
На торговом графике EURCAD M30 сформировалась разворотная фигура «Двойная вершина». Характеристика: Верхняя граница 1.5590; Нижняя граница 1.5393; Ширина фигуры 197 пунктов. Сигнал: Пробой нижней границы 1.5393 приведет к дальнейшему нисходящему движению с перспективой хода к уровню 1.5363.
- Все
- Все
- Bearish Rectangle
- Bearish Symmetrical Triangle
- Bearish Symmetrical Triangle
- Bullish Rectangle
- Double Top
- Double Top
- Triple Bottom
- Triple Bottom
- Triple Top
- Triple Top
- Все
- Все
- Покупка
- Продажа
- Все
- 1
- 2
- 3
- 4
- 5
Bullish Rectangle
was formed on 01.05 at 18:33:45 (UTC+0)
signal strength 1 of 5
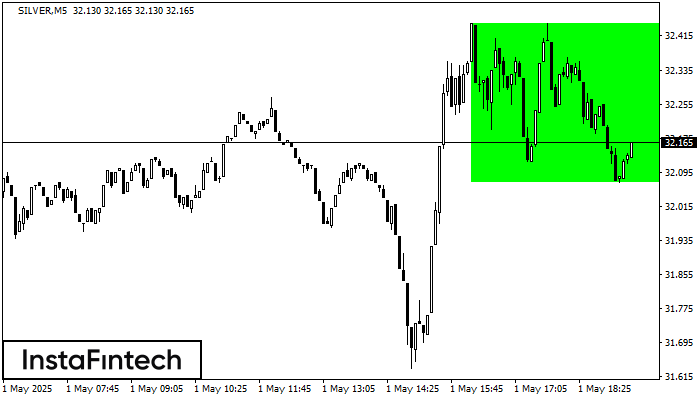
According to the chart of M5, SILVER formed the Bullish Rectangle. The pattern indicates a trend continuation. The upper border is 32.45, the lower border is 32.07. The signal means
The M5 and M15 time frames may have more false entry points.
Open chart in a new window
Double Top
was formed on 01.05 at 18:30:14 (UTC+0)
signal strength 1 of 5
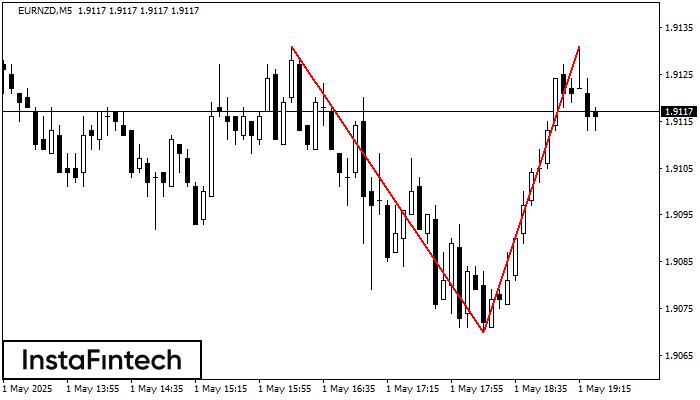
The Double Top reversal pattern has been formed on EURNZD M5. Characteristics: the upper boundary 1.9131; the lower boundary 1.9070; the width of the pattern is 61 points. Sell trades
The M5 and M15 time frames may have more false entry points.
Open chart in a new window
Triple Bottom
was formed on 01.05 at 17:39:48 (UTC+0)
signal strength 1 of 5

The Triple Bottom pattern has been formed on #KO M5. It has the following characteristics: resistance level 71.64/71.57; support level 71.39/71.35; the width is 25 points. In the event
The M5 and M15 time frames may have more false entry points.
Open chart in a new window