

Долзарб паттернлар

Тройная вершина
сформирован 18.04 в 15:15:28 (UTC+0)
сила сигнала 2 из 5
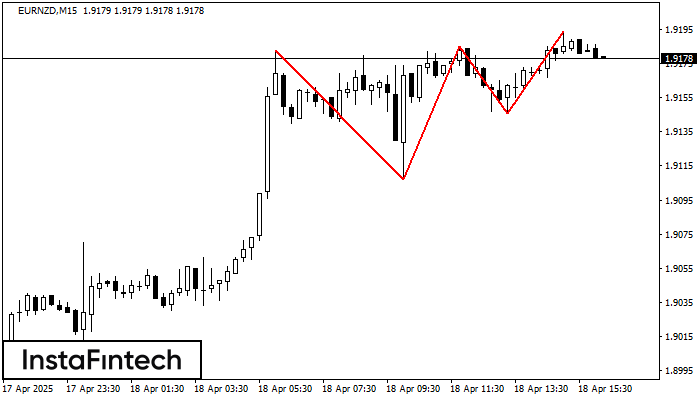
На графике EURNZD M15 образовалась фигура «Тройная вершина». Данная фигура относится к типу разворотных и имеет характеристику: Верхняя граница 1.9183/1.9194; Нижняя граница 1.9107/1.9146; Ширина фигуры 39 пунктов. Прогноз: В случае пробоя нижней границы 1.9107 вероятно дальнейшее нисходящее движение к уровню 1.9162.
Таймфреймы М5 и М15 могут иметь больше ложных точек входа.
Шунингдек кўринг
- Все
- Все
- Bearish Rectangle
- Bearish Symmetrical Triangle
- Bearish Symmetrical Triangle
- Bullish Rectangle
- Double Top
- Double Top
- Triple Bottom
- Triple Bottom
- Triple Top
- Triple Top
- Все
- Все
- Покупка
- Продажа
- Все
- 1
- 2
- 3
- 4
- 5
Bearish Rectangle
was formed on 01.05 at 04:45:28 (UTC+0)
signal strength 1 of 5
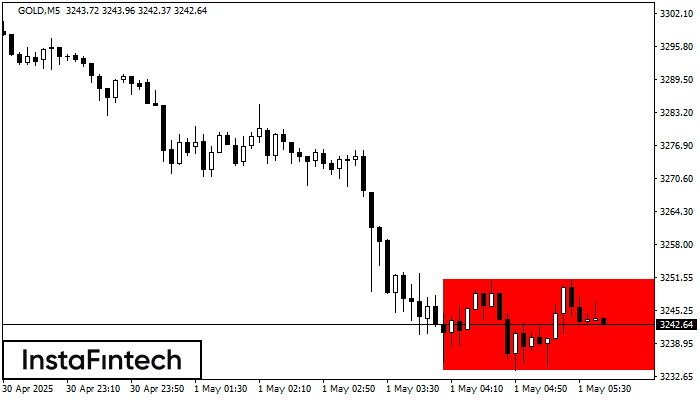
According to the chart of M5, GOLD formed the Bearish Rectangle. The pattern indicates a trend continuation. The upper border is 3251.29, the lower border is 3233.91. The signal means
The M5 and M15 time frames may have more false entry points.
Open chart in a new window
Double Top
was formed on 01.05 at 04:00:53 (UTC+0)
signal strength 3 of 5
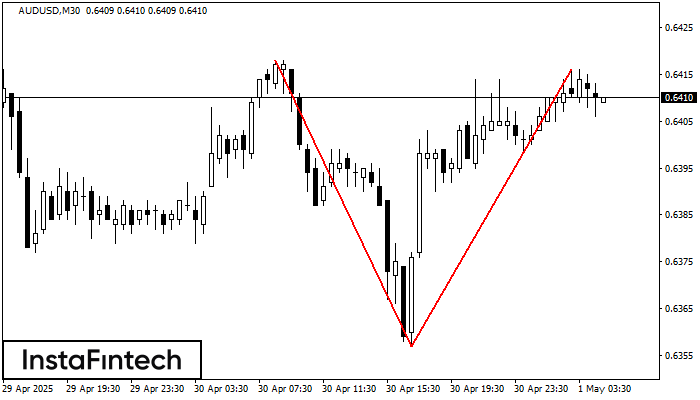
The Double Top reversal pattern has been formed on AUDUSD M30. Characteristics: the upper boundary 0.6418; the lower boundary 0.6357; the width of the pattern is 59 points. Sell trades
Open chart in a new window
Double Top
was formed on 01.05 at 04:00:52 (UTC+0)
signal strength 2 of 5
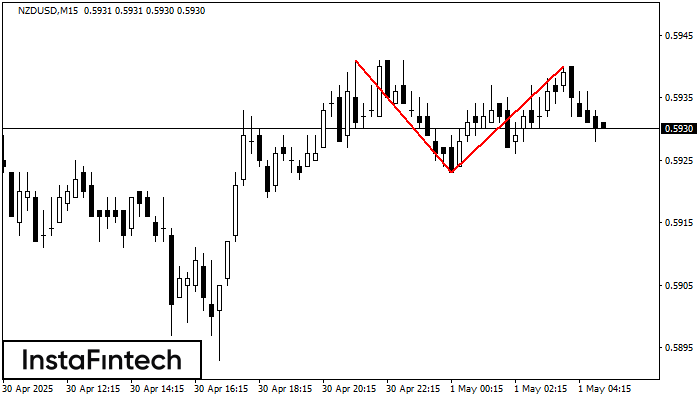
The Double Top pattern has been formed on NZDUSD M15. It signals that the trend has been changed from upwards to downwards. Probably, if the base of the pattern 0.5923
The M5 and M15 time frames may have more false entry points.
Open chart in a new window
