Actual patterns

Patterns are graphical models which are formed in the chart by the price. According to one of the technical analysis postulates, history (price movement) repeats itself. It means that the price movements are often similar in the same situations which makes it possible to predict the further development of the situation with a high probability.
Relevant patterns by InstaTrade is an easy-to-use service which allows you to be aware of latest changes in the market and react to clues from the market in time. In our service you will always find the latest and most relevant patterns on any pair and any timeframe.
Actual Patterns
- All
- All
- Bearish Rectangle
- Bearish Symmetrical Triangle
- Bearish Symmetrical Triangle
- Bullish Rectangle
- Double Top
- Double Top
- Triple Bottom
- Triple Bottom
- Triple Top
- Triple Top
- All
- All
- Buy
- Sale
- All
- 1
- 2
- 3
- 4
- 5
Bearish Symmetrical Triangle
was formed on 28.04 at 15:58:08 (UTC+0)
signal strength 1 of 5
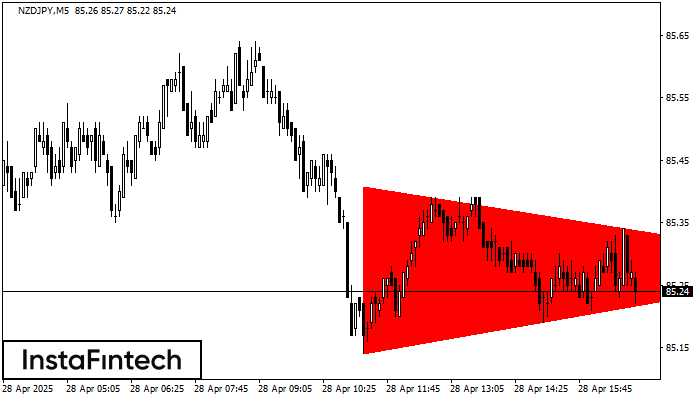
According to the chart of M5, NZDJPY formed the Bearish Symmetrical Triangle pattern. This pattern signals a further downward trend in case the lower border 85.14 is breached. Here
The M5 and M15 time frames may have more false entry points.
Open chart in a new window
Bearish Symmetrical Triangle
was formed on 28.04 at 15:44:08 (UTC+0)
signal strength 3 of 5
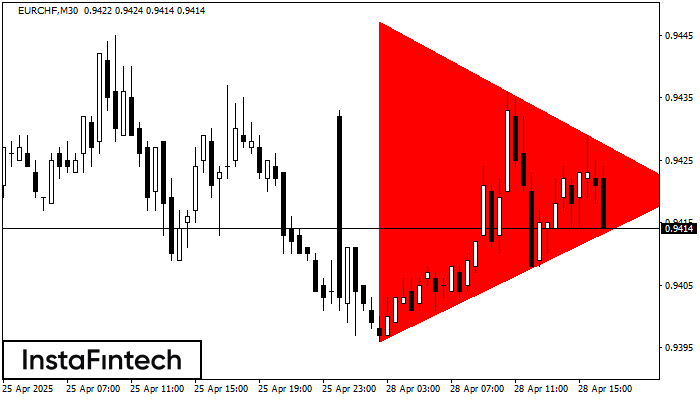
According to the chart of M30, EURCHF formed the Bearish Symmetrical Triangle pattern. Description: The lower border is 0.9396/0.9420 and upper border is 0.9447/0.9420. The pattern width is measured
Open chart in a new window
Bearish Symmetrical Triangle
was formed on 28.04 at 15:38:09 (UTC+0)
signal strength 1 of 5
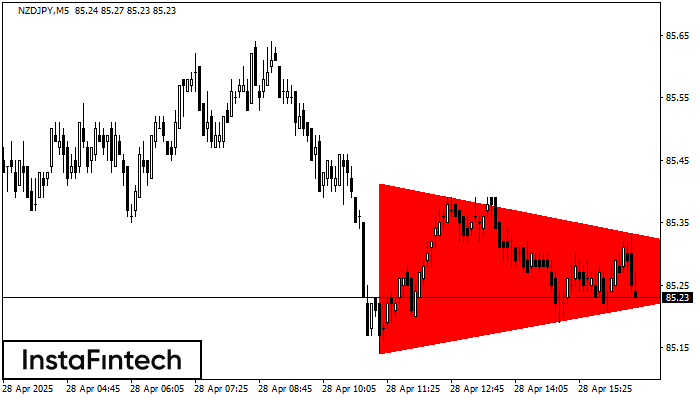
According to the chart of M5, NZDJPY formed the Bearish Symmetrical Triangle pattern. This pattern signals a further downward trend in case the lower border 85.14 is breached. Here
The M5 and M15 time frames may have more false entry points.
Open chart in a new window
Double Top
was formed on 28.04 at 15:30:14 (UTC+0)
signal strength 5 of 5
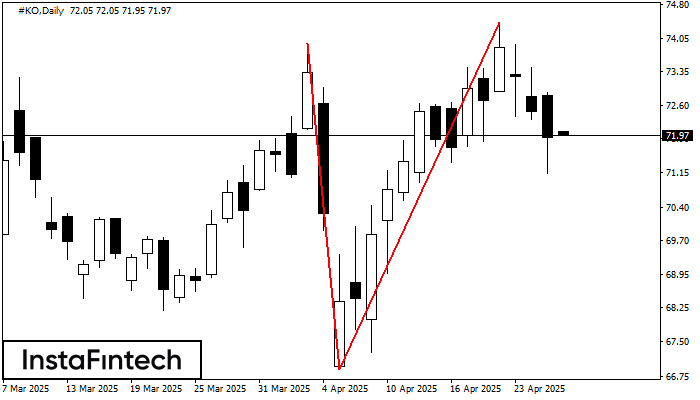
On the chart of #KO D1 the Double Top reversal pattern has been formed. Characteristics: the upper boundary 74.39; the lower boundary 66.91; the width of the pattern 748 points
Open chart in a new window
Bearish Symmetrical Triangle
was formed on 28.04 at 15:18:04 (UTC+0)
signal strength 2 of 5
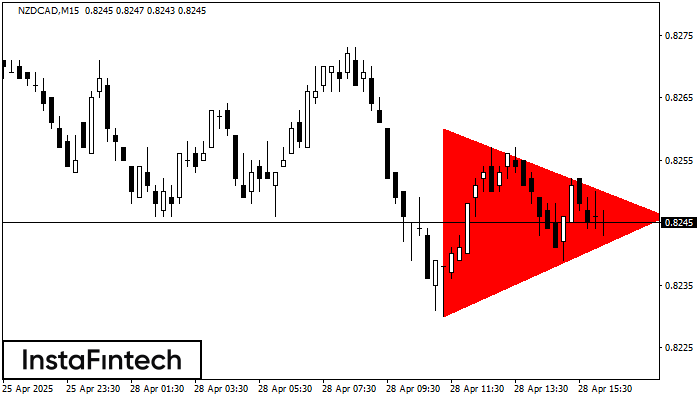
According to the chart of M15, NZDCAD formed the Bearish Symmetrical Triangle pattern. Description: The lower border is 0.8230/0.8246 and upper border is 0.8260/0.8246. The pattern width is measured
The M5 and M15 time frames may have more false entry points.
Open chart in a new window
Bearish Symmetrical Triangle
was formed on 28.04 at 14:56:35 (UTC+0)
signal strength 1 of 5
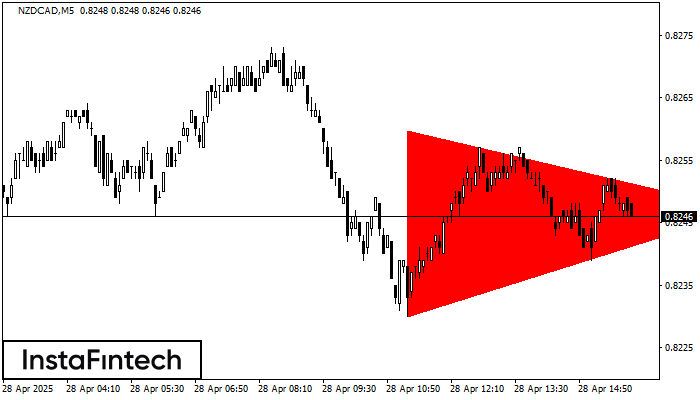
According to the chart of M5, NZDCAD formed the Bearish Symmetrical Triangle pattern. This pattern signals a further downward trend in case the lower border 0.8230 is breached. Here
The M5 and M15 time frames may have more false entry points.
Open chart in a new window
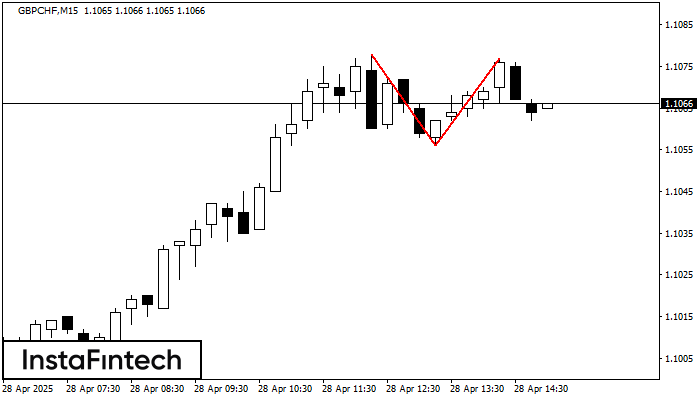
Bullish Rectangle
was formed on 28.04 at 14:53:28 (UTC+0)
signal strength 2 of 5
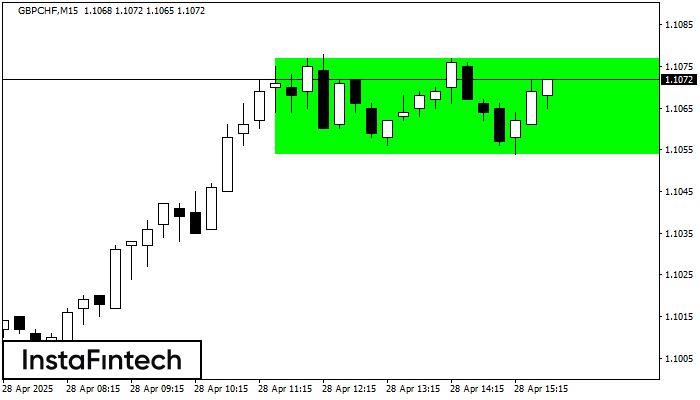
According to the chart of M15, GBPCHF formed the Bullish Rectangle. The pattern indicates a trend continuation. The upper border is 1.1077, the lower border is 1.1054. The signal means
The M5 and M15 time frames may have more false entry points.
Open chart in a new window
Bullish Rectangle
was formed on 28.04 at 14:32:27 (UTC+0)
signal strength 1 of 5
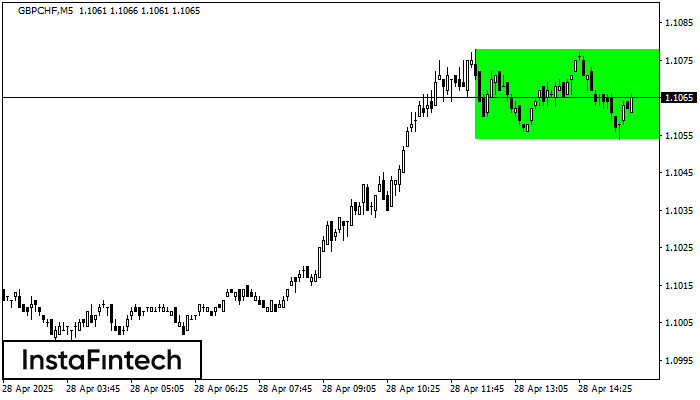
According to the chart of M5, GBPCHF formed the Bullish Rectangle. This type of a pattern indicates a trend continuation. It consists of two levels: resistance 1.1078 and support 1.1054
The M5 and M15 time frames may have more false entry points.
Open chart in a new window
Double Top
was formed on 28.04 at 14:00:25 (UTC+0)
signal strength 2 of 5
On the chart of GBPCHF M15 the Double Top reversal pattern has been formed. Characteristics: the upper boundary 1.1077; the lower boundary 1.1056; the width of the pattern 21 points
The M5 and M15 time frames may have more false entry points.
Open chart in a new window