یہ بھی دیکھیں


 21.02.2025 08:22 AM
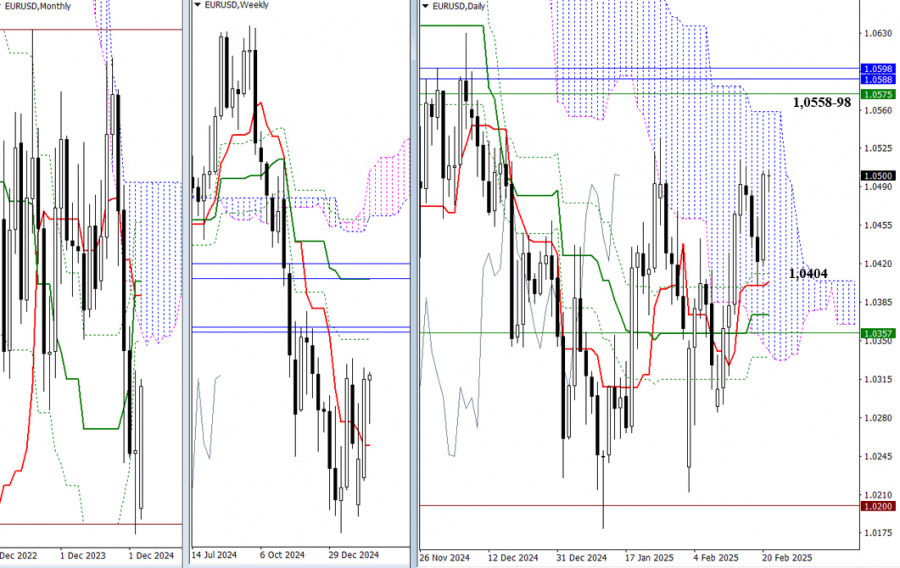
During the first half of the week, bearish traders executed a corrective decline down to the daily short-term trend level at 1.0404. However, by the last working day, the currency pair was once again poised to continue its upward movement, with the aim of updating the high at 1.0515 and restoring the daily uptrend. The primary target for this upward trajectory is now the 1.0558 – 1.0598 zone. A close above this range would allow the pair to enter the bullish zone relative to the daily cloud, setting a higher target and eventually leading it into the monthly Ichimoku cloud, where the upper boundary would become an important bullish reference point. The market continues to receive support from the daily Ichimoku cross at 1.0411, 1.0404, 1.0373, and 1.0335, which is reinforced by the weekly short-term trend at 1.0357.
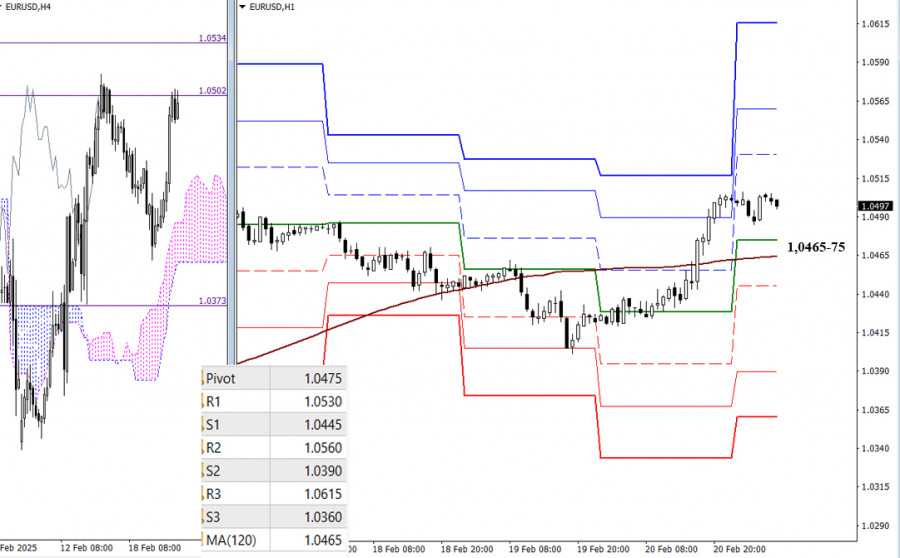
On the lower timeframes, bullish traders currently hold the main advantage. They have returned to the first target for breaking through the H4 cloud at 1.0502. If the H4 target of 1.0534 is broken, the market's intraday focus will shift to the resistance levels indicated by the classic Pivot Points at 1.0530, 1.0560, and 1.0615. Should another rebound occur, the next developments will depend on testing key support levels that converge today around 1.0465-75 (central Pivot level + weekly long-term trend). A breakout and trend reversal could shift the balance of power, with the next support targets being the classic Pivot Point levels at 1.0445, 1.0390, and 1.0360.
***
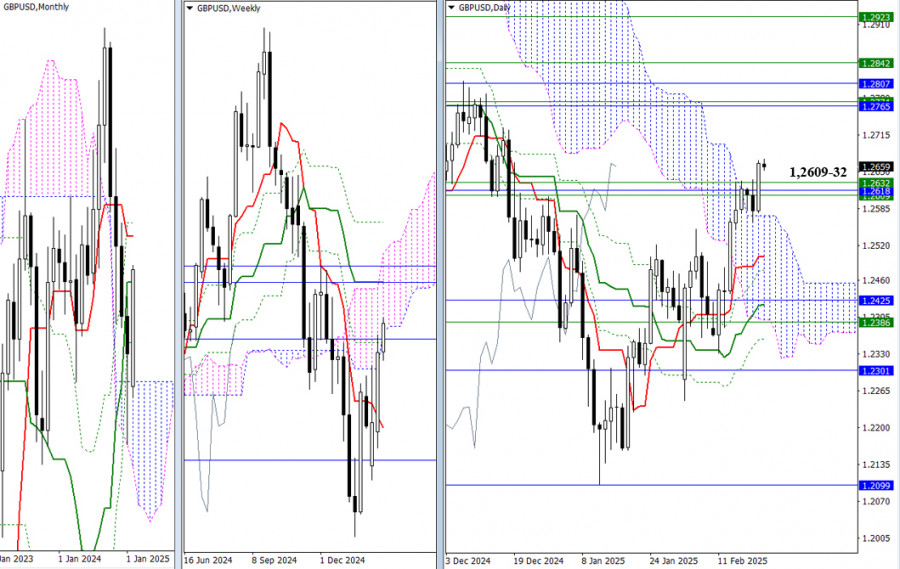
Bullish traders have successfully executed a daily breakout from the resistance zone (1.2609 – 1.2632), which includes significant levels from higher timeframes. In this scenario, it's important to wait for confirmation of the breakout on the weekly and monthly timeframes. If bullish traders manage to achieve this, they will face several key tasks: reclaiming support from both the weekly medium-term trend and the monthly short-term trend, exiting the weekly cloud to consolidate in a bullish zone, and eliminating the weekly Ichimoku dead cross. Successfully completing all these tasks would unlock even greater bullish potential.
However, if the bulls lack the strength to maintain their position and their opponents take the initiative, the daily breakout could be reversed by a weekly decline from the lower boundary of the weekly cloud (1.2651), leading to a drop back to previous support levels. The nearest support levels below the 1.2609 – 1.2632 zone on the daily timeframe are found at 1.2572 and 1.2502.
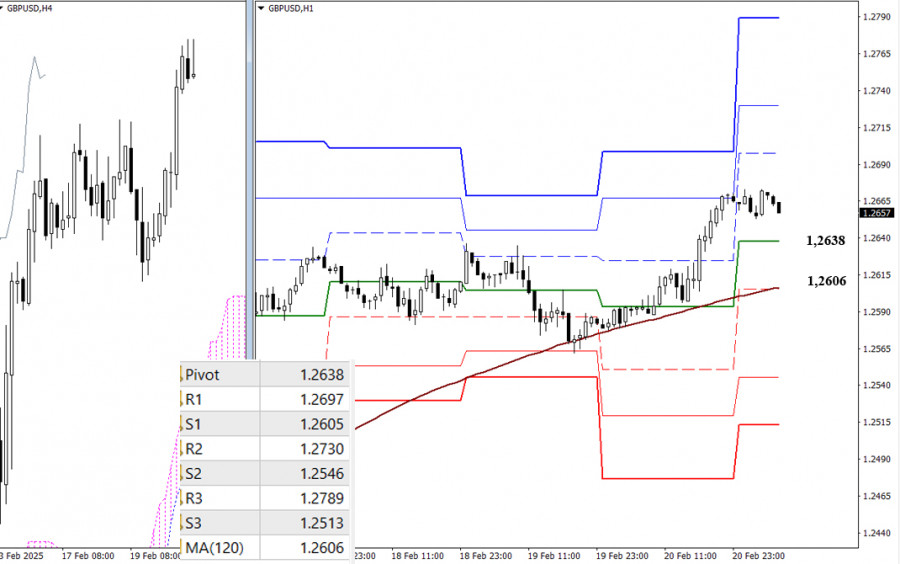
On the lower timeframes, bullish traders currently hold the main advantage. The resistance levels of the classic Pivot Points (1.2697 – 1.2730 – 1.2789) serve as intraday targets for continued growth. Should there be another corrective decline, key levels to monitor include 1.2638 (the central Pivot level of the day) and 1.2606 (the weekly long-term trend). A breakout and trend reversal could shift the balance in favor of bearish sentiment. If a decline occurs, additional downside targets might include the support levels of the classic Pivot Points S2 (1.2546) and S3 (1.2513).
***
You have already liked this post today
*تعینات کیا مراد ہے مارکیٹ کے تجزیات یہاں ارسال کیے جاتے ہیں جس کا مقصد آپ کی بیداری بڑھانا ہے، لیکن تجارت کرنے کے لئے ہدایات دینا نہیں.
انسٹا فاریکس کلب

Your IP address shows that you are currently located in the USA. If you are a resident of the United States, you are prohibited from using the services of InstaFintech Group including online trading, online transfers, deposit/withdrawal of funds, etc.
If you think you are seeing this message by mistake and your location is not the US, kindly proceed to the website. Otherwise, you must leave the website in order to comply with government restrictions.
Why does your IP address show your location as the USA?
Please confirm whether you are a US resident or not by clicking the relevant button below. If you choose the wrong option, being a US resident, you will not be able to open an account with InstaTrade anyway.
We are sorry for any inconvenience caused by this message.


