اصل پیٹرن یعنی ایکچوئل پیٹرن

پیٹرن تصویری صورت یعنی گرافکل ماڈلز ہوتے ہیں جو کہ چارٹ میں قیمت کی جانب سے بنتے ہیں جو کہ ٹیکنیکل تجزیات کے امکانات ، ہسٹری {قیمت کے اتار چڑھاو} چونکہ قیمت اپنے آپ کو دہراتی ہے - جس کا مطلب یہ ہے کہ قیمت کا اتار چڑھا یعنی حرکت ایک جیسے حالات میں ہی عموما مختلف ہوتی ہے جو کہ اس بات کو ممکن بناتی ہے قیمت کے مزید رویہ کی پیشن گوئی کی جاسکے جس کا اُسی طرح ہونے کے امکانات خاصے واضح ہوتے ہیں
انسٹا فاریکس کی "ریلی وینٹ" پیٹرنز نامی سروس استعمال میں بہت ہی آسان ہے جو کہ آپ کو مارکیٹ میں ہونے والی تازہ ترین تبدیلیوں کے حوالے باخبر رکھتے ہیں اور مارکیٹ کے ملنے والے اشاروں پر بر وقت در عمل دینے کے قابل کرتے ہیں - ہماری سہولیات سے آپ ہمیشہ پائیں گے تازہ ترین اور سب سے ذیادہ کار آمد انداز یعنی ریلی وینٹ انداز دستیاب ہوں گے- جو کہ کسی بھی پئیر اور ٹائم فریم کے حوالے سے دستیاب ہوں گے
Actual Patterns
- All
- All
- Bearish Rectangle
- Bearish Symmetrical Triangle
- Bearish Symmetrical Triangle
- Bullish Rectangle
- Double Top
- Double Top
- Triple Bottom
- Triple Bottom
- Triple Top
- Triple Top
- All
- All
- Buy
- Sale
- All
- 1
- 2
- 3
- 4
- 5
Double Top
was formed on 17.04 at 18:15:13 (UTC+0)
signal strength 1 of 5
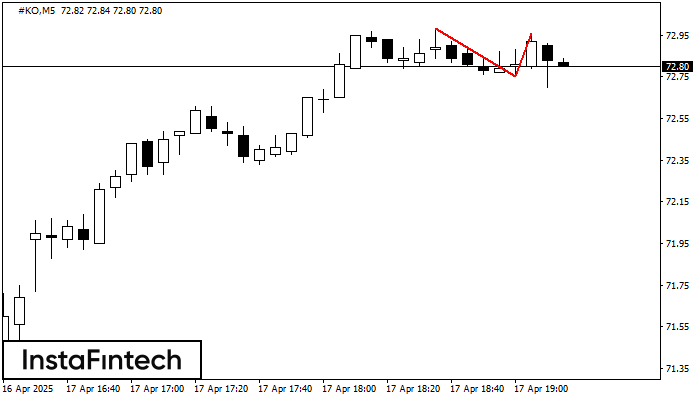
On the chart of #KO M5 the Double Top reversal pattern has been formed. Characteristics: the upper boundary 72.96; the lower boundary 72.75; the width of the pattern 21 points
The M5 and M15 time frames may have more false entry points.
Open chart in a new window
Double Bottom
was formed on 17.04 at 18:00:01 (UTC+0)
signal strength 1 of 5
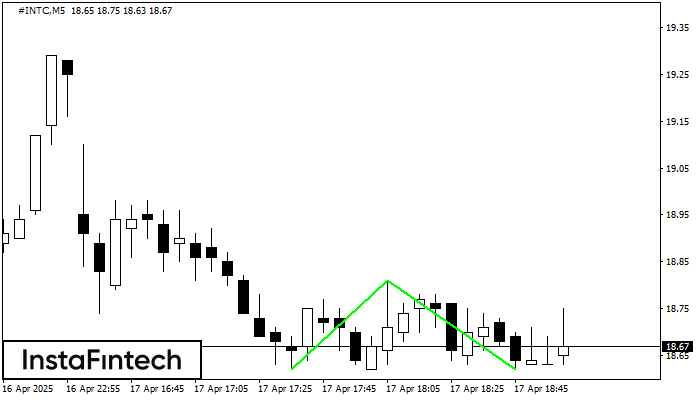
The Double Bottom pattern has been formed on #INTC M5; the upper boundary is 18.81; the lower boundary is 18.62. The width of the pattern is 19 points. In case
The M5 and M15 time frames may have more false entry points.
Open chart in a new window
Triple Top
was formed on 17.04 at 17:45:29 (UTC+0)
signal strength 1 of 5

On the chart of the NZDCAD M5 trading instrument, the Triple Top pattern that signals a trend change has formed. It is possible that after formation of the third peak
The M5 and M15 time frames may have more false entry points.
Open chart in a new window
Inverse Head and Shoulder
was formed on 17.04 at 17:44:51 (UTC+0)
signal strength 1 of 5
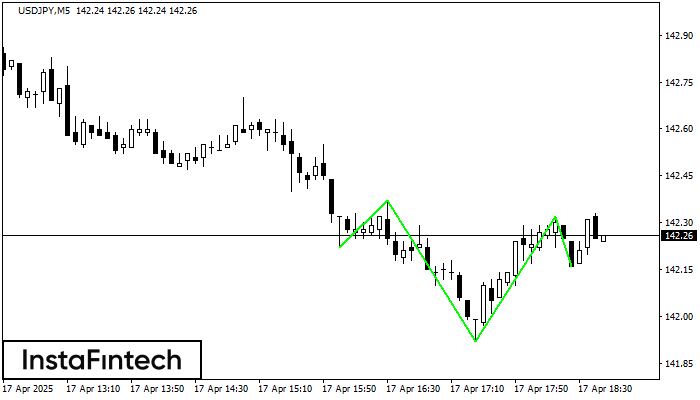
According to the chart of M5, USDJPY produced the pattern termed the Inverse Head and Shoulder. The Head is fixed at 141.92 while the median line of the Neck
The M5 and M15 time frames may have more false entry points.
Open chart in a new window
Double Bottom
was formed on 17.04 at 17:14:56 (UTC+0)
signal strength 2 of 5
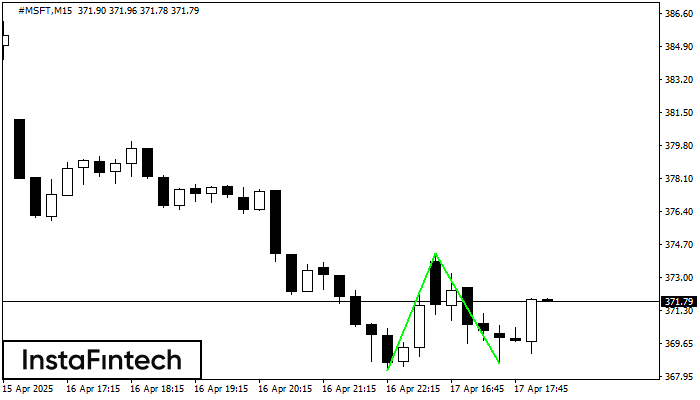
The Double Bottom pattern has been formed on #MSFT M15. This formation signals a reversal of the trend from downwards to upwards. The signal is that a buy trade should
The M5 and M15 time frames may have more false entry points.
Open chart in a new window
Double Bottom
was formed on 17.04 at 17:14:47 (UTC+0)
signal strength 2 of 5
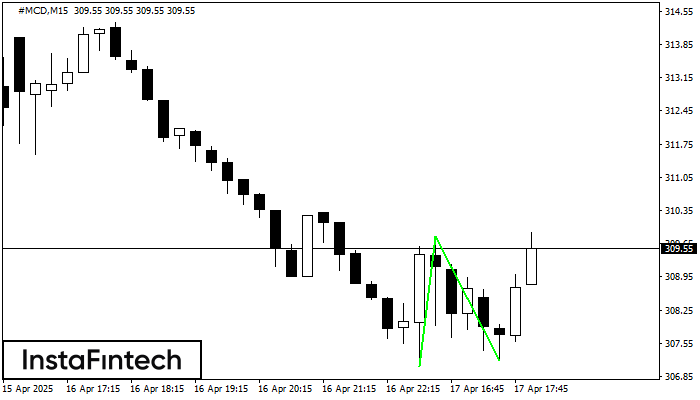
The Double Bottom pattern has been formed on #MCD M15. Characteristics: the support level 307.06; the resistance level 309.81; the width of the pattern 275 points. If the resistance level
The M5 and M15 time frames may have more false entry points.
Open chart in a new window
Double Top
was formed on 17.04 at 17:00:07 (UTC+0)
signal strength 3 of 5
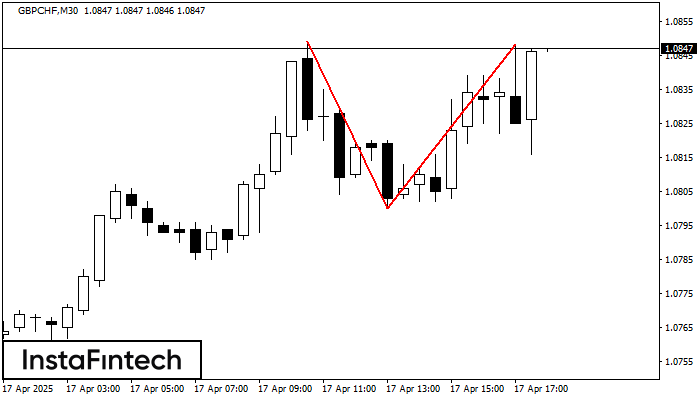
The Double Top pattern has been formed on GBPCHF M30. It signals that the trend has been changed from upwards to downwards. Probably, if the base of the pattern 1.0800
Open chart in a new window
Double Bottom
was formed on 17.04 at 16:54:34 (UTC+0)
signal strength 1 of 5
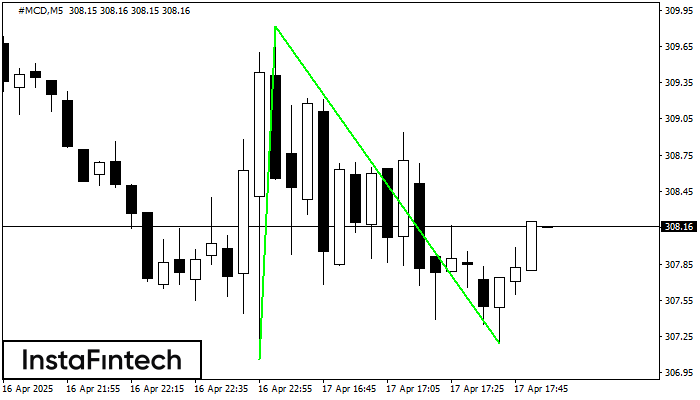
The Double Bottom pattern has been formed on #MCD M5. Characteristics: the support level 307.06; the resistance level 309.81; the width of the pattern 275 points. If the resistance level
The M5 and M15 time frames may have more false entry points.
Open chart in a new window
Double Top
was formed on 17.04 at 16:39:50 (UTC+0)
signal strength 1 of 5
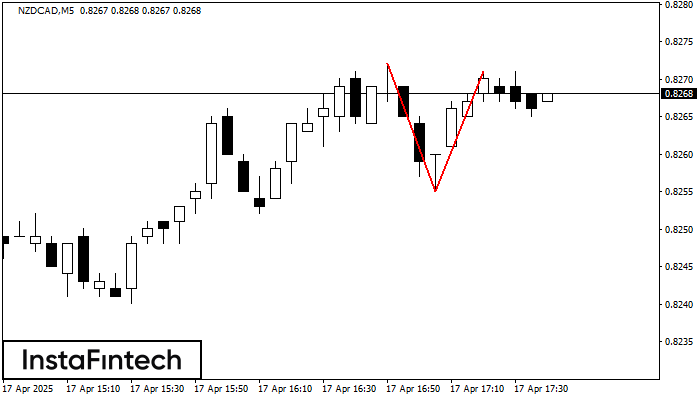
The Double Top pattern has been formed on NZDCAD M5. It signals that the trend has been changed from upwards to downwards. Probably, if the base of the pattern 0.8255
The M5 and M15 time frames may have more false entry points.
Open chart in a new window