Veja também


 26.04.2023 07:41 AM
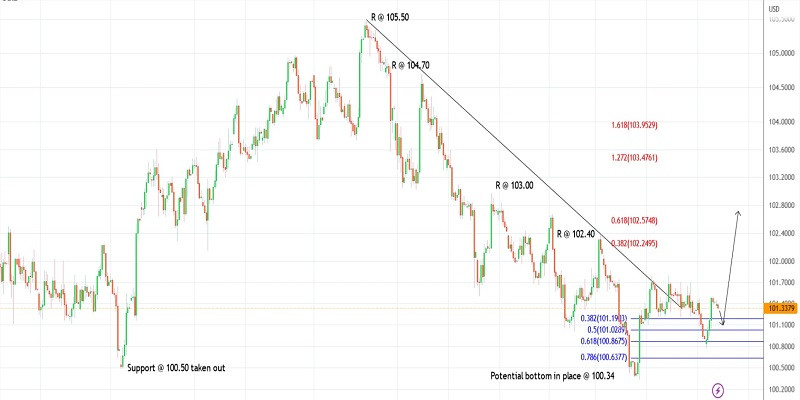
The US dollar index reversed sharply higher after carving a higher low around 100.85 on Tuesday. The index jumped by almost 70 points and approached closely 101.50 before pulling back. It is seen to be trading around 101.30 at this point in writing and is expected to continue its rally further towards 102.50 and up to 105.50 soon.
The US dollar index is on its way to completing the larger-degree Down Gartley corrective rally towards 105.50 and 106.50 respectively. It is now developing its last-leg rally against the 100.34 low, so a break above 103.00 will confirm that the bulls are back in control to push further. Also, note that the potential for the above rally remains up to the 108.00-109.00 zone before the pattern could complete.
The US dollar index remains well supported around 101.00 and a drop there will find the bulls coming back into play. Earlier, the index found support at the Fibonacci 0.618 retracement of the lower-degree upswing (100.34 through 101.80) and bounced higher as seen on the 4H chart. Ideally, prices should now stay above 100.34.
A potential rally against 100.00
Good luck!
You have already liked this post today
*A análise de mercado aqui postada destina-se a aumentar o seu conhecimento, mas não dar instruções para fazer uma negociação.
Na minha previsão matinal, destaquei o nível 1,1378 e planejei basear as decisões de entrada no mercado nele. Vamos dar uma olhada no gráfico de 5 minutos e analisar
Na minha previsão matinal, concentrei-me no nível 1,1358 e planejei tomar decisões de negociação com base nele. Vamos dar uma olhada no gráfico de 5 minutos para entender
Análise das operações de segunda-feira Gráfico 1H do EUR/USD O par EUR/USD iniciou a segunda-feira com uma forte recuperação. Durante a madrugada, o euro avançou entre 100 e 120 pips
Análise das operações de quinta-feira Gráfico 1H do GBP/USD Nas últimas 24 horas, o par GBP/USD avançou 170 pips, e a valorização da libra esterlina continuou durante a madrugada desta
Análise das operações de sexta-feira Gráfico 1H do GBP/USD O par GBP/USD registrou uma forte correção na sexta-feira, um movimento difícil de justificar — mesmo com a vantagem da retrospectiva
Análise das operações de sexta-feira Gráfico 1H de EUR/USD O par EUR/USD permaneceu sob forte instabilidade nesta sexta-feira. Desta vez, o movimento de baixa predominou — mas isso não tornou
Na minha previsão matinal, destaquei o nível 1,0994 e planejei basear minhas decisões de entrada no mercado nele. Vamos dar uma olhada no gráfico de 5 minutos e analisar
O par GBP/USD também registrou um forte movimento de alta na quinta-feira, impulsionado por um único fator. No final da noite de quarta-feira, Donald Trump anunciou a imposição de novas
Gráfico de Forex
Versão-Web

Your IP address shows that you are currently located in the USA. If you are a resident of the United States, you are prohibited from using the services of InstaFintech Group including online trading, online transfers, deposit/withdrawal of funds, etc.
If you think you are seeing this message by mistake and your location is not the US, kindly proceed to the website. Otherwise, you must leave the website in order to comply with government restrictions.
Why does your IP address show your location as the USA?
Please confirm whether you are a US resident or not by clicking the relevant button below. If you choose the wrong option, being a US resident, you will not be able to open an account with InstaTrade anyway.
We are sorry for any inconvenience caused by this message.

