Veja também


 14.09.2023 01:59 PM
EUR/USD
Higher Timeframes
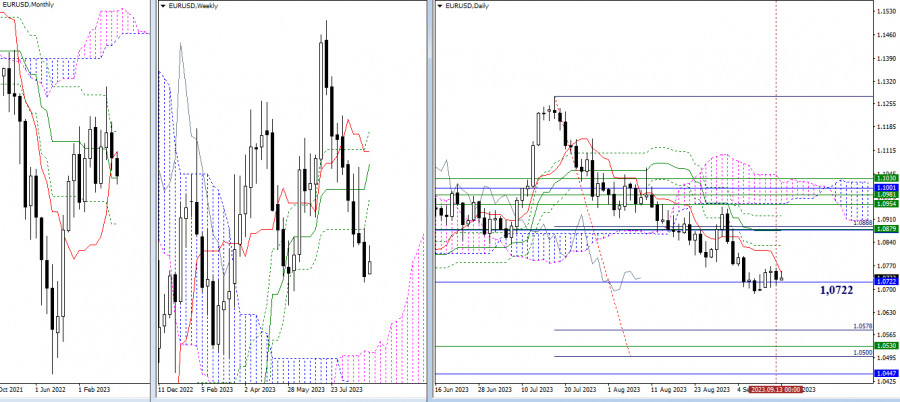
The situation has remained virtually unchanged for the past day. The daily consolidation with the center of attraction at 1.0722 (monthly medium-term trend) persists. The daily short-term trend has descended into the consolidation zone (1.0748). Other reference points mentioned earlier remain in place. For bullish players, the most important area during an upward trend will be the region between 1.0875–79 (daily medium-term trend + monthly short-term trend + weekly Fibonacci Kijun), with intermediate resistance at 1.0830 (daily Fibonacci Kijun). For bearish players after the correction is completed, the support zone is of interest, including the daily target for breaking the Ichimoku cloud (1.0500 - 1.0578), the upper boundary of the weekly cloud (1.0530), and the final level of the monthly Ichimoku cross (1.0447).
H4 - H1
On lower timeframes, the situation continues to be restrained by the weekly long-term trend (1.0727), which is currently almost horizontal. These circumstances indicate ongoing uncertainty in the movement's development, as confirmed by the daily consolidation. The classic pivot points serve as references for intraday movement development. For bullish players, the important resistances are 1.0759 - 1.0788 - 1.0812, while for bearish players, the supports that may come in handy are 1.0706 - 1.0682 - 1.0653.
***
GBP/USD
Higher Timeframes
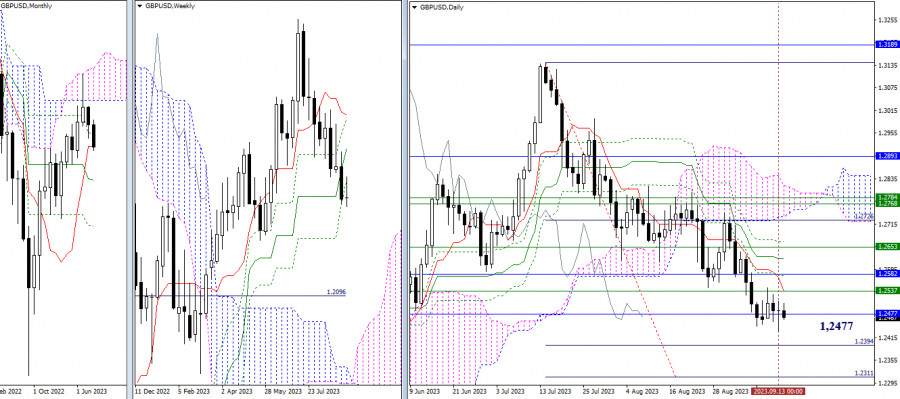
The attraction and influence of the monthly short-term trend (1.2477) continue to restrain market activity, so the main conclusions and expectations remain the same. It is worth noting that the location of the target reference points is also unchanged. Thus, in the event of increasing bearish sentiment, attention will be directed to achieving the daily target for breaking the Ichimoku cloud (1.2394 - 1.2311), and in the case of bullish activity, it will be crucial to pass through 1.2537 - 1.2582 (weekly and monthly Fibonacci Kijun + daily short-term trend).
H4 - H1
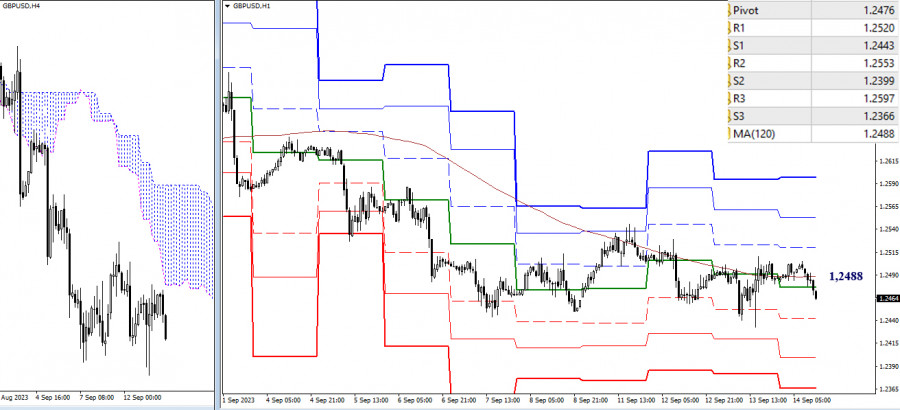
On lower timeframes, the situation has not changed. The weekly long-term trend (1.2488) continues to restrain movement development, and the market remains within its attraction and influence zone. If the situation changes within the day, the classic pivot points (1.2443 - 1.2399 - 1.2366) will be significant for the bearish players, while the resistances of the classic pivot points (1.2520 - 1.2553 - 1.2597) will be significant for the bulls.
***
The technical analysis of the situation uses:
Higher timeframes - Ichimoku Kinko Hyo (9.26.52) + Fibo Kijun levels
Lower timeframes - H1 - Pivot Points (classic) + Moving Average 120 (weekly long-term trend)
You have already liked this post today
*A análise de mercado aqui postada destina-se a aumentar o seu conhecimento, mas não dar instruções para fazer uma negociação.
Ao analisarmos o gráfico de 4 horas do par de moedas commodities USD/CAD, é possível identificar uma divergência entre o movimento de preço e o indicador Stochastic Oscillator. Embora
Com o surgimento de uma convergência entre o movimento de preço da commodity Platina e o indicador Stochastic Oscillator, além do suporte adicional do preço movendo-se acima da WMA (210)
No gráfico de 4 horas, o indicador Oscilador Estocástico aponta um sinal de compra, acompanhado pelo movimento de preços acima da média móvel ponderada de 21 períodos (WMA 21)
Embora os vendedores ainda dominem o EUR/JPY no gráfico de 4 horas — o que é confirmado pelo movimento de preços abaixo da média móvel ponderada de 21 períodos (WMA
Your IP address shows that you are currently located in the USA. If you are a resident of the United States, you are prohibited from using the services of InstaFintech Group including online trading, online transfers, deposit/withdrawal of funds, etc.
If you think you are seeing this message by mistake and your location is not the US, kindly proceed to the website. Otherwise, you must leave the website in order to comply with government restrictions.
Why does your IP address show your location as the USA?
Please confirm whether you are a US resident or not by clicking the relevant button below. If you choose the wrong option, being a US resident, you will not be able to open an account with InstaTrade anyway.
We are sorry for any inconvenience caused by this message.


