Vea también


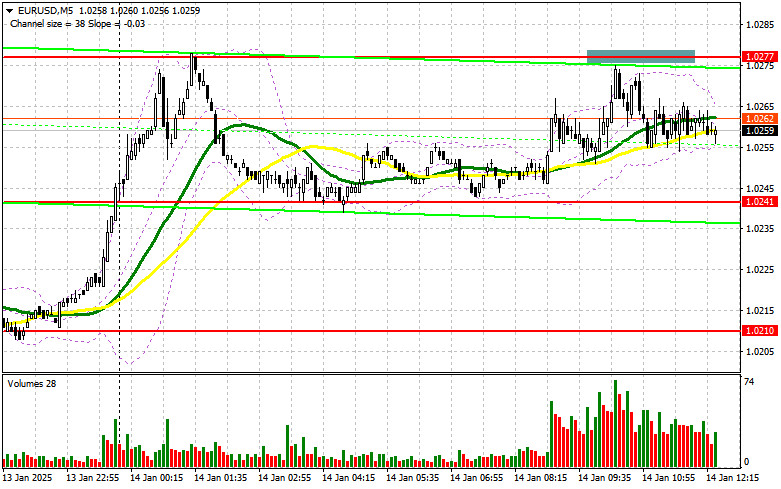
In my morning forecast, I focused on the 1.0277 level and planned to make trading decisions based on it. Let's look at the 5-minute chart to see what happened. The price rose but fell just a couple of points short of testing this range and forming a false breakout, leaving me without trades in the first half of the day. For the second half of the day, the technical picture was revised.
The euro remains within a channel, unable to break above yesterday's high, suggesting that pressure on the pair could return during the US session as significant fundamental statistics are expected. Today will act as a "warm-up" before tomorrow's key US Consumer Price Index (CPI) data. Reports on the US Producer Price Index (PPI) and Core PPI excluding food and energy prices are anticipated. A rise in these indicators could bolster the US dollar. Additionally, speeches from FOMC members John Williams and Jeffrey Schmid will be in focus, providing the first comments following last week's strong US labor market report.
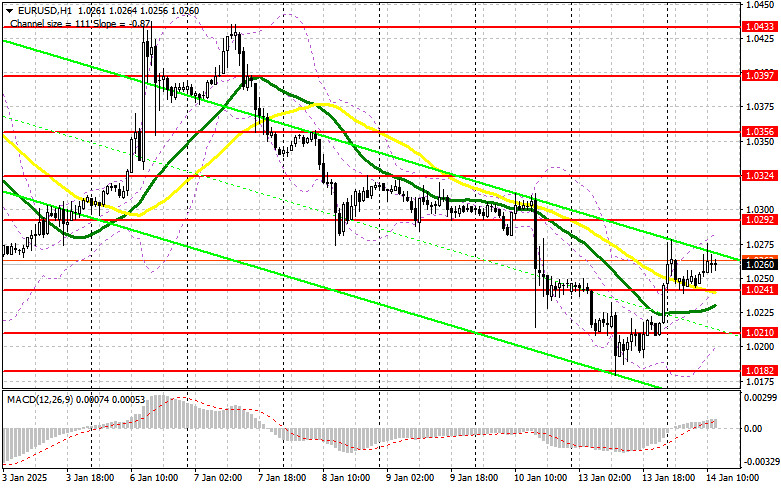
If pressure returns to the pair, I plan to act only near the closest support at 1.0241, which narrowly missed a test earlier today. Only a false breakout there would provide a good entry point for buying, targeting resistance at 1.0292. A breakout and retest of this range would confirm a valid entry point for a push toward 1.0324. The ultimate target will be the 1.0356 high, where I will lock in profits. If EUR/USD declines amid strong US data and lacks activity near 1.0241, the pressure will intensify, with sellers likely pushing the pair toward 1.0210 and 1.0182, marking a new yearly low. I will consider long positions only after a false breakout at these levels. Immediate buying on a rebound will be considered at 1.0132, targeting a 30-35 point intraday correction.
Sellers are not particularly active, as yesterday's rumors related to trade tariffs have discouraged selling the euro at current lows. A false breakout around the new resistance at 1.0292 would provide an entry point for short positions, targeting support at 1.0241, where moving averages favor buyers. A breakout and consolidation below this range, followed by a retest from below, would be another suitable scenario for selling, aiming for the 1.0210 low and further to 1.0182, reinforcing the bearish trend. The ultimate target would be 1.0132, where I will lock in profits.
If EUR/USD rises in the second half of the day and bears remain inactive around 1.0292, I will postpone short positions until the next resistance at 1.0324. I will sell there only after a failed breakout. If no downward movement occurs at this level, I will look for short positions on a rebound near 1.0356, targeting a 30-35 point intraday correction.
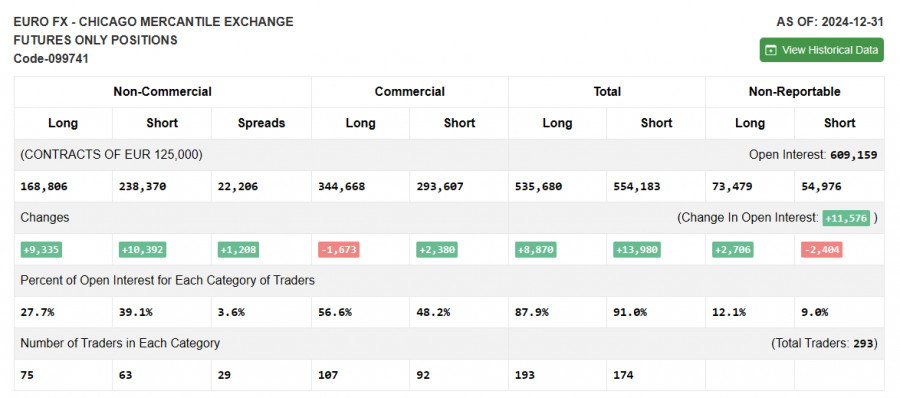
The December 31 COT report showed a nearly equal rise in long and short positions. Given that the Federal Reserve's policy remained unchanged at the end of the year, the focus is likely to shift to Donald Trump's inauguration and his protectionist rhetoric. However, any statements from Fed officials will also play a critical role in determining the future direction of the US dollar and should not be ignored. The COT report revealed that non-commercial long positions increased by 9,335 to 168,806, while short positions grew by 10,392 to 238,370, widening the gap between longs and shorts by 1,208.
Moving Averages:
Trading is occurring above the 30- and 50-day moving averages, indicating further pair correction potential.
Note: The moving average periods and prices analyzed by the author are based on the hourly H1 chart and differ from classical daily moving averages on the D1 chart.
Bollinger Bands:
In the event of a decline, the lower boundary of the indicator at 1.0200 will act as support.
You have already liked this post today
*El análisis de mercado publicado aquí tiene la finalidad de incrementar su conocimiento, más no darle instrucciones para realizar una operación.


Indicador de
patrones gráficos.
¡Note cosas
que nunca notará!
Club InstaForex

Your IP address shows that you are currently located in the USA. If you are a resident of the United States, you are prohibited from using the services of InstaFintech Group including online trading, online transfers, deposit/withdrawal of funds, etc.
If you think you are seeing this message by mistake and your location is not the US, kindly proceed to the website. Otherwise, you must leave the website in order to comply with government restrictions.
Why does your IP address show your location as the USA?
Please confirm whether you are a US resident or not by clicking the relevant button below. If you choose the wrong option, being a US resident, you will not be able to open an account with InstaTrade anyway.
We are sorry for any inconvenience caused by this message.


