Patrones actuales

Los patrones son modelos gráficos que se forman en el gráfico mediante el precio. Según uno de los postulados del análisis técnico, la historia (movimiento del precio) se repite. Esto quiere decir que los movimientos del precio a menudo son similares en las mismas situaciones que hacen posible pronosticar el futuro desarrollo de la situación con una alta probabilidad.
Los patrones relevantes de InstaTrade son un servicio fácil de utilizar que permiten que conozca los últimos cambios en el mercado y reaccione a las pistas del mercado a tiempo. En nuestro servicio, siempre encontrará los últimos y más importantes patrones en cualquier par y en cualquier marco de tiempo.
Bearish Rectangle
was formed on 24.03 at 11:24:07 (UTC+0)
signal strength 1 of 5
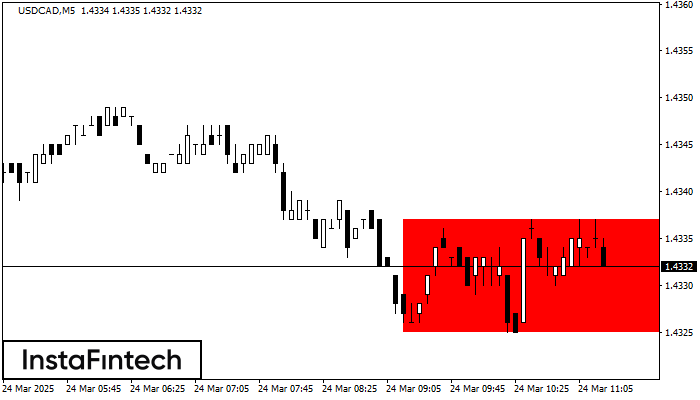
According to the chart of M5, USDCAD formed the Bearish Rectangle which is a pattern of a trend continuation. The pattern is contained within the following borders: lower border 1.4325 – 1.4325 and upper border 1.4337 – 1.4337. In case the lower border is broken, the instrument is likely to follow the downward trend.
The M5 and M15 time frames may have more false entry points.
Vea asimismo
- All
- All
- Bearish Rectangle
- Bearish Symmetrical Triangle
- Bearish Symmetrical Triangle
- Bullish Rectangle
- Double Top
- Double Top
- Triple Bottom
- Triple Bottom
- Triple Top
- Triple Top
- All
- All
- Buy
- Sale
- All
- 1
- 2
- 3
- 4
- 5
Bandera bajista
was formed on 01.04 at 12:50:23 (UTC+0)
signal strength 1 of 5

El patrón Bandera bajista ha sido formado en el gráfico USDCHF M5. Por consiguiente, es probable que la tendencia bajista continúe a corto plazo. Tan pronto el precio rompa
Los marcos de tiempo M5 y M15 pueden tener más puntos de entrada falsos.
Open chart in a new window
Banderín bajista
was formed on 01.04 at 12:50:18 (UTC+0)
signal strength 1 of 5
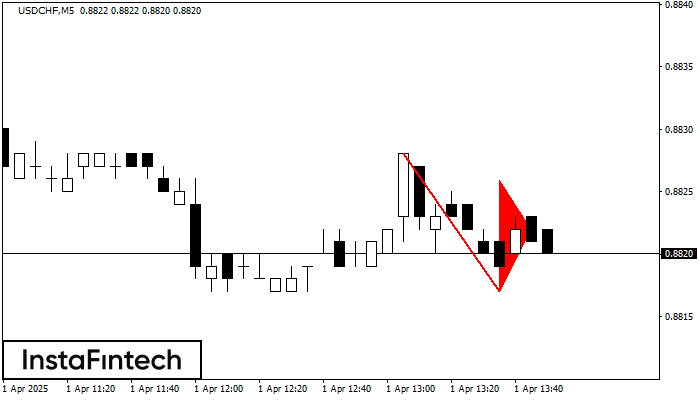
El patrón Banderín bajista se ha formado en el gráfico USDCHF M5. Esto señala la continuación potencial de la tendencia existente. Especificaciones: el piso del patrón tiene la coordinada
Los marcos de tiempo M5 y M15 pueden tener más puntos de entrada falsos.
Open chart in a new window
Triángulo Simétrico Alcista
was formed on 01.04 at 11:03:47 (UTC+0)
signal strength 3 of 5

Según el gráfico de M30, el GBPUSD formó el patrón Triángulo Simétrico Alcista. El límite inferior del patrón toca las coordenadas 1.2876/1.2915 donde el límite superior cruza 1.2971/1.2915
Open chart in a new window