Patrones actuales

Los patrones son modelos gráficos que se forman en el gráfico mediante el precio. Según uno de los postulados del análisis técnico, la historia (movimiento del precio) se repite. Esto quiere decir que los movimientos del precio a menudo son similares en las mismas situaciones que hacen posible pronosticar el futuro desarrollo de la situación con una alta probabilidad.
Los patrones relevantes de InstaTrade son un servicio fácil de utilizar que permiten que conozca los últimos cambios en el mercado y reaccione a las pistas del mercado a tiempo. En nuestro servicio, siempre encontrará los últimos y más importantes patrones en cualquier par y en cualquier marco de tiempo.
Bearish pennant
was formed on 21.04 at 17:59:57 (UTC+0)
signal strength 3 of 5
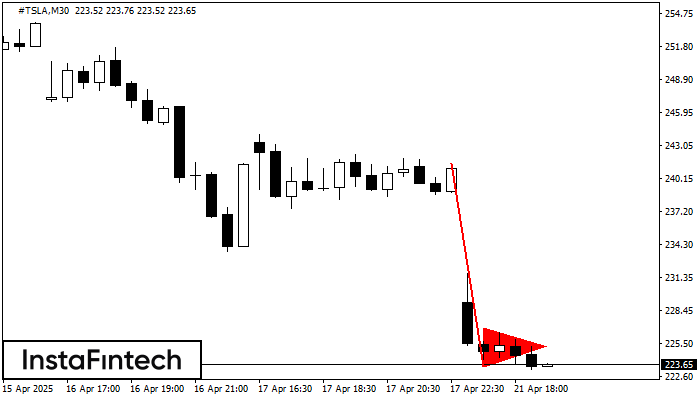
The Bearish pennant pattern has formed on the #TSLA M30 chart. It signals potential continuation of the existing trend. Specifications: the pattern’s bottom has the coordinate of 223.47; the projection of the flagpole height is equal to 1803 pips. In case the price breaks out the pattern’s bottom of 223.47, the downtrend is expected to continue for further level 223.17.
Vea asimismo
- All
- All
- Bearish Rectangle
- Bearish Symmetrical Triangle
- Bearish Symmetrical Triangle
- Bullish Rectangle
- Double Top
- Double Top
- Triple Bottom
- Triple Bottom
- Triple Top
- Triple Top
- All
- All
- Buy
- Sale
- All
- 1
- 2
- 3
- 4
- 5
Doble Techo
was formed on 30.04 at 08:10:41 (UTC+0)
signal strength 1 of 5
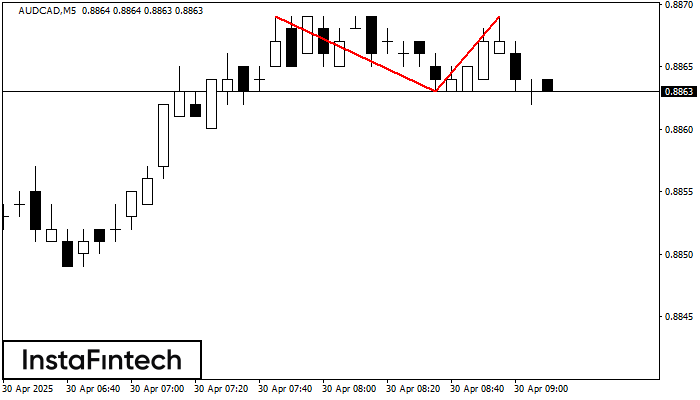
El patrón Doble Techo ha sido formado en AUDCAD M5. Esto señala que la tendencia ha sido cambiada de alcista a bajista. Probablemente, si la base del patrón 0.8863
Los marcos de tiempo M5 y M15 pueden tener más puntos de entrada falsos.
Open chart in a new window
Doble Piso
was formed on 30.04 at 08:00:27 (UTC+0)
signal strength 3 of 5
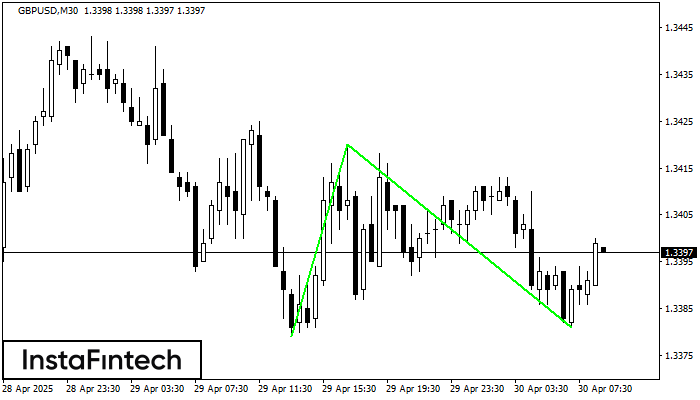
El patrón Doble Piso ha sido formado en GBPUSD M30. Características: el nivel de soporte 1.3379; el nivel de resistencia 1.3420; el ancho del patrón 41 puntos. Si el nivel
Open chart in a new window
Triple Techo
was formed on 30.04 at 07:55:10 (UTC+0)
signal strength 1 of 5
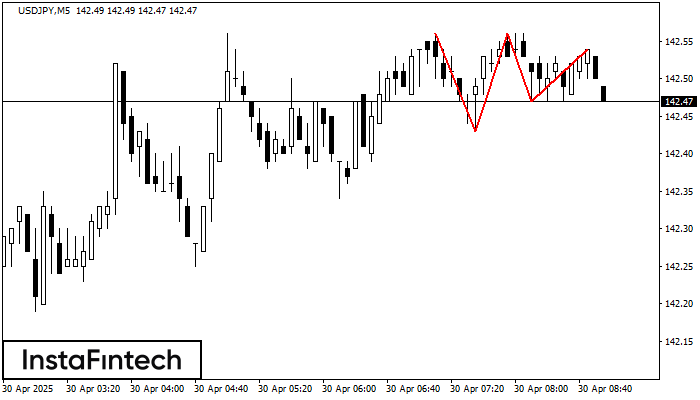
El patrón Triple Techo ha sido formado en el gráfico de USDJPY M5. Características del patrón: los límites tienen un ángulo ascendente, la línea inferior del patrón tiene coordenadas 142.43/142.47
Los marcos de tiempo M5 y M15 pueden tener más puntos de entrada falsos.
Open chart in a new window