Patrones actuales

Los patrones son modelos gráficos que se forman en el gráfico mediante el precio. Según uno de los postulados del análisis técnico, la historia (movimiento del precio) se repite. Esto quiere decir que los movimientos del precio a menudo son similares en las mismas situaciones que hacen posible pronosticar el futuro desarrollo de la situación con una alta probabilidad.
Los patrones relevantes de InstaTrade son un servicio fácil de utilizar que permiten que conozca los últimos cambios en el mercado y reaccione a las pistas del mercado a tiempo. En nuestro servicio, siempre encontrará los últimos y más importantes patrones en cualquier par y en cualquier marco de tiempo.
Bullish pennant
was formed on 23.04 at 20:00:19 (UTC+0)
signal strength 3 of 5
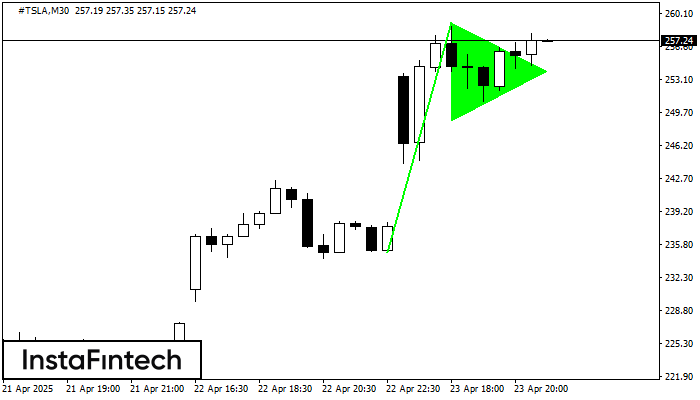
The Bullish pennant graphic pattern has formed on the #TSLA M30 instrument. This pattern type falls under the category of continuation patterns. In this case, if the quote can breaks out high, is expected to continue the upward trend to level 259.48.
Vea asimismo
- All
- All
- Bearish Rectangle
- Bearish Symmetrical Triangle
- Bearish Symmetrical Triangle
- Bullish Rectangle
- Double Top
- Double Top
- Triple Bottom
- Triple Bottom
- Triple Top
- Triple Top
- All
- All
- Buy
- Sale
- All
- 1
- 2
- 3
- 4
- 5
Triple Piso
was formed on 29.05 at 23:30:14 (UTC+0)
signal strength 2 of 5
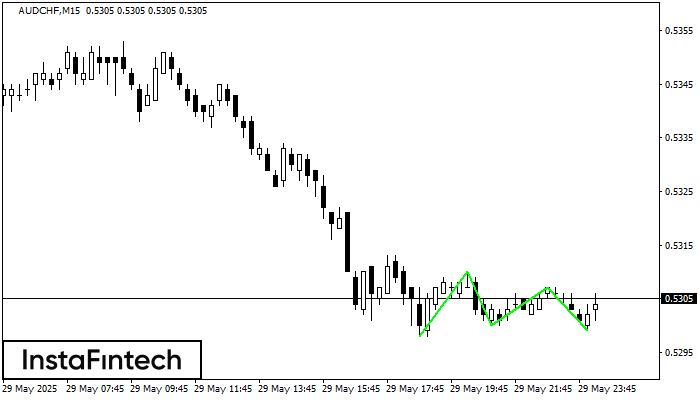
El patrón Triple Piso ha sido formado en el gráfico de AUDCHF M15. Características del patrón: línea inferior del patrón tiene coordenadas 0.5310 con el límite superior 0.5310/0.5307, la proyección
Los marcos de tiempo M5 y M15 pueden tener más puntos de entrada falsos.
Open chart in a new window
Rectángulo Alcista
was formed on 29.05 at 23:04:26 (UTC+0)
signal strength 5 of 5
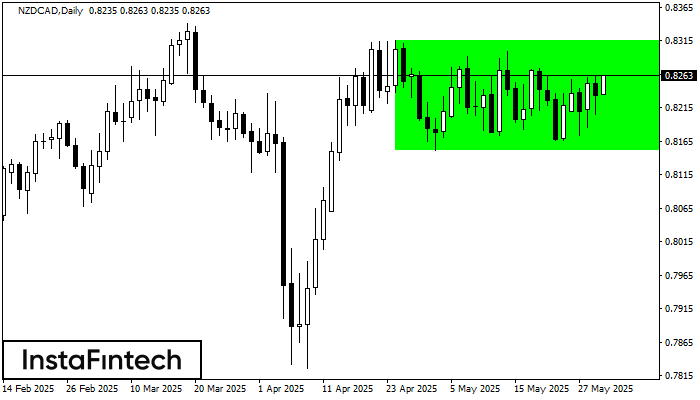
Según el gráfico de D1, NZDCAD formó el Rectángulo Alcista. El patrón indica la continuación de una tendencia. El límite superior es 0.8316, el límite inferior es 0.8151. La señal
Open chart in a new window
Triángulo Simétrico Bajista
was formed on 29.05 at 22:19:03 (UTC+0)
signal strength 1 of 5
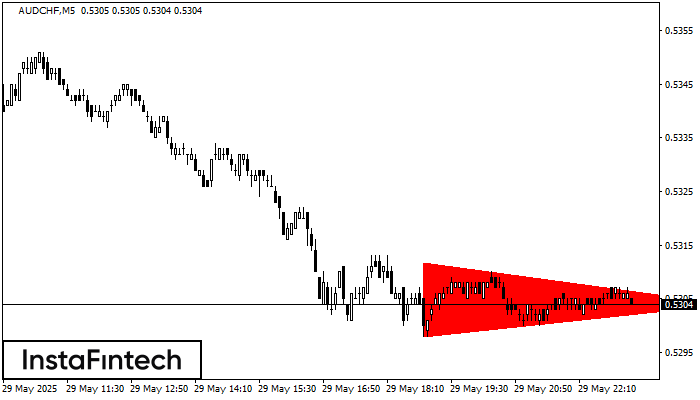
Según el gráfico de M5, el AUDCHF formó el patrón Triángulo Simétrico Bajista. Recomendaciones de negociación: es posible que una ruptura del límite inferior 0.5298 fomente una continuación
Los marcos de tiempo M5 y M15 pueden tener más puntos de entrada falsos.
Open chart in a new window